The government released its first look at GDP for the second quarter of 2012 along with revisions to estimates from previous years. Economic growth in the Spring was 1.5%, close to expectations and confirming the sluggishness economy. Business investment in equipment led the growth, rising 7.2% followed by exports, which rose by 5.3%. A minor plus was an increase in consumer spending on services, which rose 1.9% (not strong, but more than any quarter since it rose by a similar amount in 2011Q2. Both consumer purchases of goods and business investment in structures weakend considerably, and were the lowest growth rates in a year. Government purchases also continued to be a drag on the economy. Removing inventories, final sales grew by 1.2%, the slowest rate since early 2011. Inflation as measured by the PCE index declined to 0.7%, the lowest rate since Spring 2010. Over the past year, inflation has been 1.6% while core inflation has been 1.8%.
As is customary, the government revised prior data based on new information. The recession was slightly less severe, "only" a decline of 4.7% (still the largest decline since the Great Depression), and the initial stage of the recovery was weaker than initially reported (2.4% growth in 2010 instead of 3%). Much of the downward revision for 2010 was due to more moderate increase in equipment investment than previously thought. The economy came very close to shrinking in the first quarter of 2011, with growth not reported at a 0.1% annualized rate, but rebounded in the second quarter, growing 2.5%, nearly double the prior report.
The two strongest quarters of economic growth since the end of the recession were the fourth quarters of 2009 and 2011. In both cases, much, if not all, of the growth was due to a sruge in inventories and thus were not sustainable. In 2009Q4, the economy grew by 4%, but if you subtract the impact of inventories, it actually declined by just over 0.5% while in 2011Q4, the economy grew by 4.1%, but only by 1.6% once inventories are excluded.
What did we learn from today's report? Revisions to previous data still show a severe downturn in 2008-2009 followed by even a more modest recovery than previously reported in 2010. Data for the second quarter of 2012 still show an economy that is growing, but quite slowly. Corporate profits declined in early 2012 for the first time since 2011Q1. After boosting profits for years, overseas profits declined by the most since the recession, reflecting the global slowdown including the recessions in Europe. What happens to the economy in the rest of 2012 depends on whether consumers and businesses are strong enough to offset problems from overseas (and from Washington, DC!). As of now, it looks like a continuation of slow growth.
Friday, July 27, 2012
Friday, July 20, 2012
June Job Market Report: Florida & Orlando
The latest look at the state and local job market presents more of the same: sluggish job growth. Florida's unemployment rate was unchanged at 8.6% while Orlando's unemployment rate (not seasonally adjusted) rose to 8.7% from 8.3%. Though unemployment statewide is declining, the weak labor force participation has exaggerated the decline. Though Florida's noninstitutional adult population grew by 216,000 in the last year, the labor force grew by only 33,000, reducing the participation rate to 60.1%. If the participation rate had remained stable over the last year, the unemployment rate would be 9.5% (down from 10.7%, but significantly higher than the official rate of 8.6%). Florida added 9000 jobs in June (seasonally adjusted) and nearly 71,000 over the last year, which represents an increase of 1% (a slighter faster rate than experienced in recent months). Industries showing the largest gains include wholesale & retail trade (6600), professional & business services (5600), and leisure & hospitality (4200). The losers were led by construction (5300), manufacturing (3000) and private education services (2800).
Does the increase in the unemployment rate in Orlando indicate a worsening of the local job market? Though national and state data are seasonally adjusted, local data is not. However, the BLS (Bureau of Labor Statistics) releases estimates of seasonally adjusted (SA) unemployment rates for metropolitan areas with a one month delay. Orlando's seasonally adjusted unemployment rate in May 2012 was 8.6% (as opposed to 8.3% not seasonally adjusted). Based on seasonal adjustments in previous years, the June rate is probably about 8.6% (SA), indicating little, if any, change in the unemployment rate. Over the last year, employment in Orlando increased by 1%, matching that of the state.
What's the primary takeaway from the report? Employment growth in Florida remains sluggish and weaker than the nation, but the year-over-year rate of growth has increased a little (a little good news)!
Thursday, July 12, 2012
Negative Interest Rates?
How much fear is there regarding the European Debt Crisis? Here's a chart of the two-year German government bond (note the yield was -0.04% as of July 12):
 And here's a chart of the two-year Swiss government bond (yield = -0.36% as of July 12):
 In fact, the yield on Swiss five-year government bonds are -0.01% as of noon EDT on July 12. Of course the primary reason for the negative yields is the desire for a safe haven (return of money instead of return on money). However, as mentioned in an article in Bloomberg today, the recent reduction of the interest on reserves by the European Central Bank prompted banks to purchase the short-term government bonds of the safest European countries. For those who don't know about interest on reserves, the ECB (and other central banks) pay interest on funds that banks keep at the central bank. In order to get banks to "use" the funds instead of storing them at the central bank, the ECB announced that the interest rate was going to be reduced from 0.25% to 0% effective today. How did banks respond? They shifted some funds from the safety of the central bank to the safety of short-term government bonds of the safest countries (safe means not Spain, Greece, etc.). What does this imply for the Fed policy? Some have suggested that the Fed should also reduce the interest on reserves from 0.25% to 0%. The actions of banks in Europe suggest that American banks would probably also move some of the funds to "risk-free" assets instead of increasing lending throughout the economy, thus limiting the stimulative effect of such a policy. Advocates of a reduction in the interest rate on reserves would state the lower interest on safe assets would push lenders and savers into somewhat riskier assets, which could provide some stimulus to the economy. This is a similar argument that's made for other forms of monetary stimulus recently. Unfortunately, the effects are likely to be minimal.


Friday, July 6, 2012
Recent Monetary Policy: the Role of the Velocity of Money
I just read an article which mentioned that the velocity of money declined to its lowest level since the 1930s. What's the velocity of money? It's a concept developed by economist Irving Fisher in the 1920s and considers the average number of times a typical unit of money is used in transactions in a given year. The following chart shows the behavior of the velocity of money over the last 50 years:
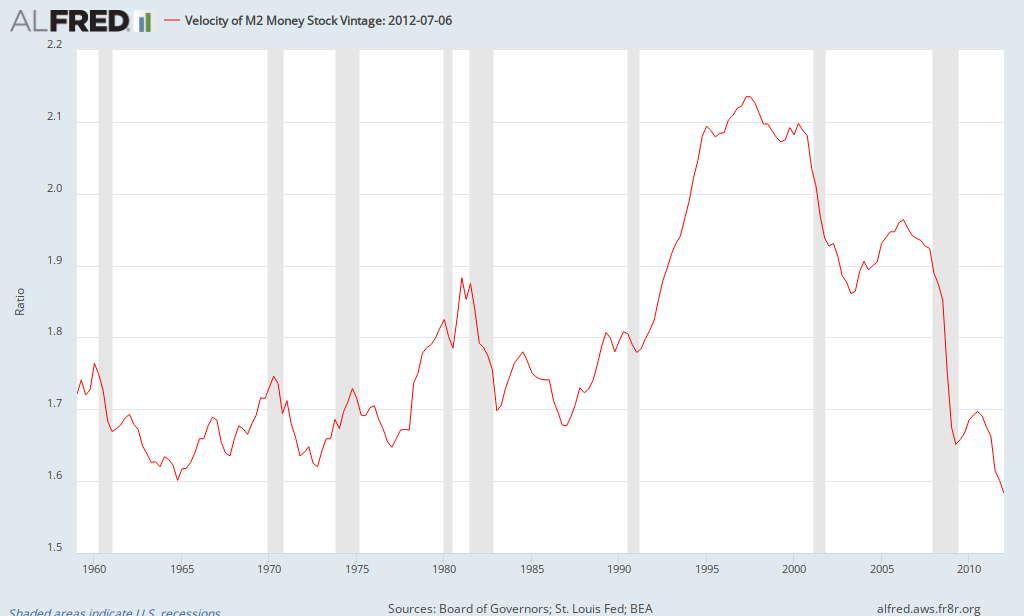
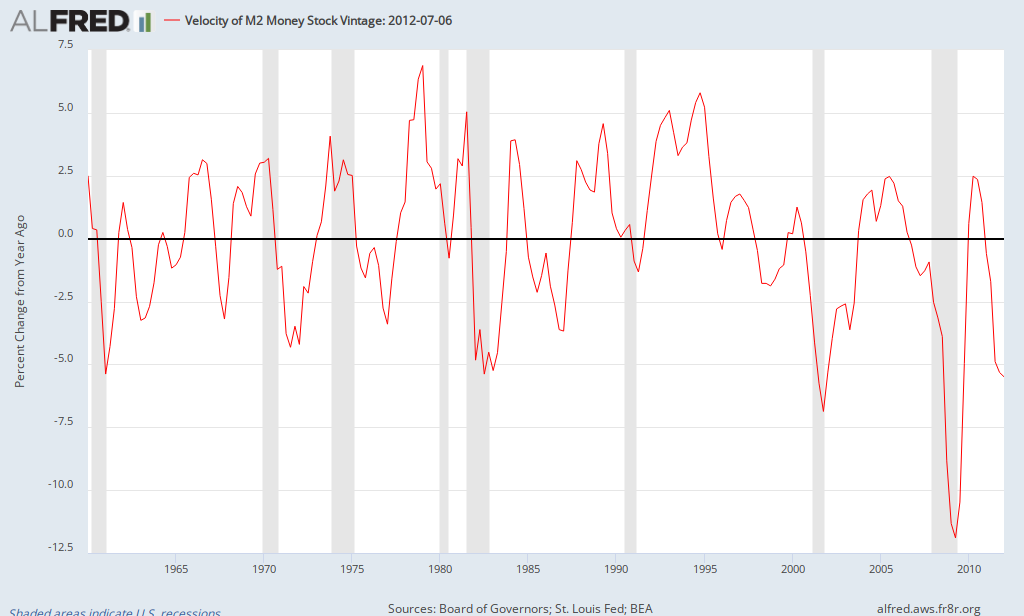
This post will primarily address the criticism that Fed policy is inflationary or has little impact by considering the role of velocity. To begin with, let's define a term that may be unfamiliar to most noneconomists, the velocity of money. Some classical economists used to assume that velocity was relatively constant, but this has not been the case in the last 50 years. Looking at either the chart above (showing velocity) or below (which shows the percent change in velocity), it's apparent that velocity tends to decline during recessions and rise during periods of more rapid economic growth (i.e., money gets used more during periods of strong growth).
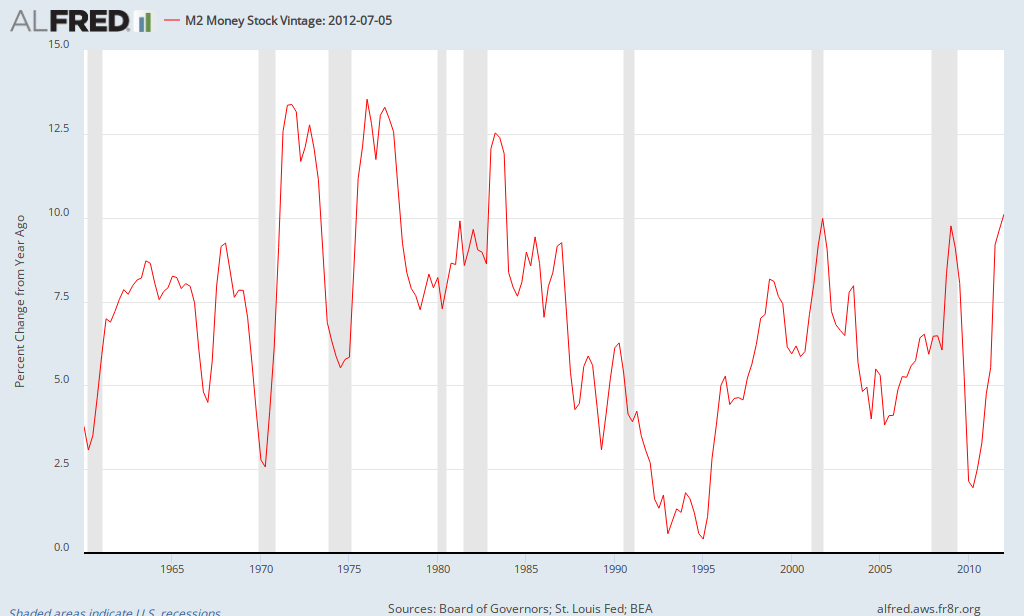
What happens if the velocity of money declines but the amount of money doesn't change? If the same amount of money is used less often, spending declines as does the economy. Thus, it's important for the Fed to increase the money supply to offset significant declines in velocity in order to stabilize the economy (note: it shouldn't micromanage small changes, but should intervene to offset singificant declines such as that seen in 2009 - see above). the following chart shows the behavior of the growth of the money supply in recent decades:
Thus, the Fed offset the large decline in the velocity of money in 2009 by increasing the money supply. When we add the two effects together, we obtain the following chart, which shows the demand for goods & services in the economy:
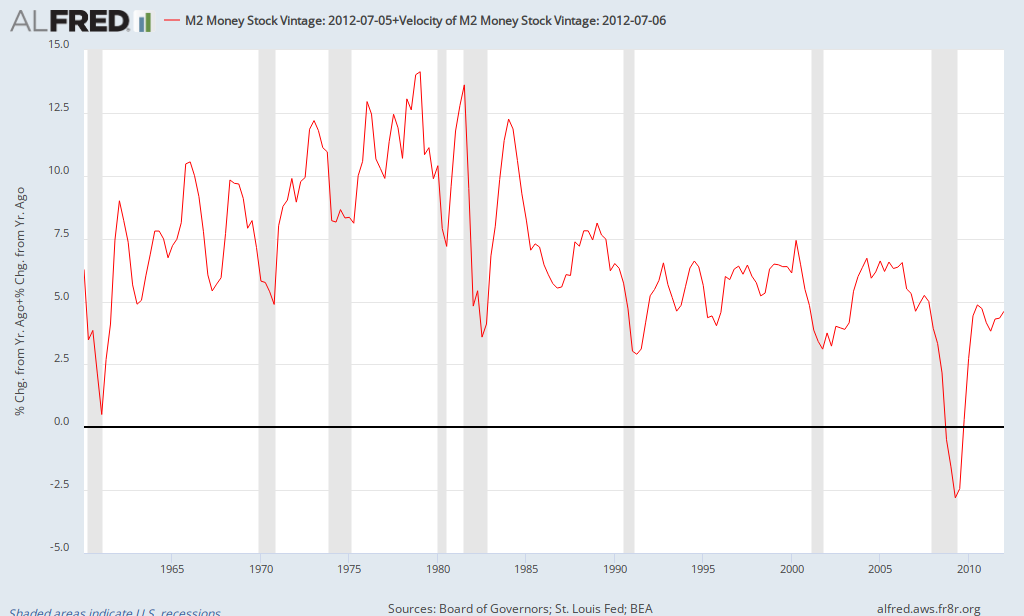
What do these charts show? In the late 1970s, the velocity of money was increasing by about 7%. The Fed did reduce the growth of the money supply, but not enough, allowing it to grow by 7.5%, resulting in a surge in demand and high inflation. Meanwhile, in 2009, velocity was plummeting and the Fed offset some of this decline, but the result was still declining demand of about 2.5%, resulting in declining inflation (and a temporary period of deflation in late 2008). Is current Fed policy inflationary? Given historical economic patterns, the answer is no. There hasn't been a period of high inflation when demand has been running at its current rate. It becomes an issue when its time for the Fed to implement its exit strategy. That is, when velocity begins to increase again, it will need to remove the stimulus in order to stabilize the economy and keep inflation in check.
This post will primarily address the criticism that Fed policy is inflationary or has little impact by considering the role of velocity. To begin with, let's define a term that may be unfamiliar to most noneconomists, the velocity of money. Some classical economists used to assume that velocity was relatively constant, but this has not been the case in the last 50 years. Looking at either the chart above (showing velocity) or below (which shows the percent change in velocity), it's apparent that velocity tends to decline during recessions and rise during periods of more rapid economic growth (i.e., money gets used more during periods of strong growth).
What happens if the velocity of money declines but the amount of money doesn't change? If the same amount of money is used less often, spending declines as does the economy. Thus, it's important for the Fed to increase the money supply to offset significant declines in velocity in order to stabilize the economy (note: it shouldn't micromanage small changes, but should intervene to offset singificant declines such as that seen in 2009 - see above). the following chart shows the behavior of the growth of the money supply in recent decades:
Thus, the Fed offset the large decline in the velocity of money in 2009 by increasing the money supply. When we add the two effects together, we obtain the following chart, which shows the demand for goods & services in the economy:
What do these charts show? In the late 1970s, the velocity of money was increasing by about 7%. The Fed did reduce the growth of the money supply, but not enough, allowing it to grow by 7.5%, resulting in a surge in demand and high inflation. Meanwhile, in 2009, velocity was plummeting and the Fed offset some of this decline, but the result was still declining demand of about 2.5%, resulting in declining inflation (and a temporary period of deflation in late 2008). Is current Fed policy inflationary? Given historical economic patterns, the answer is no. There hasn't been a period of high inflation when demand has been running at its current rate. It becomes an issue when its time for the Fed to implement its exit strategy. That is, when velocity begins to increase again, it will need to remove the stimulus in order to stabilize the economy and keep inflation in check.
June Employment Report
The June employment report provides another set of data confirming that the economy is growing at a sluggish pace. The US economy added 80,000 jobs in June and the unemployment rate remained at 8.2%. The broad measure of unemployment (U6) rose slightly to 14.9%, above the recent low of 14.5% in March-April 2012. Depending on your perspective, you can view this as significantly below its high of 17.2% in October 2009 but above the low of 7.9% prior to the recession.
About half of the jobs created were in 2 industries: temp agencies added 25,000 jobs while food services and drinking added 15,000. Local government added 4,000 jobs, but that masks some interesting dynamics. Local education shed 14,000 jobs (seasonally adjusted) while local government added 18,000 jobs in other areas. That builds on the trend from May during which local government eliminated 10,000 education jobs but added 5000 outside of education.
Though there are some problems with seasonal adjustments previously noted, employment growth declined significantly in the second quarter. The chart below shows the growth in jobs by sector in the first and second quarters of 2012, along with the change in the growth (numbers are in thousands):
Most of the decline in employment growth took place in the private sector (decline of 404,000 compared to 48,000 in government). Leading the slowdown were declines in job creation in leisure & hospitality and education (including both private & public education), each accounting for about 30% of the decline in employment growth. While employment in leisure & hospitality went from robust to flat, education went from adding 63,000 jobs to losing 56,000. Other sectors including manufacturing, professional/business services, and health care continued to add jobs, but at much slower rates while construction went from little growth to shedding jobs. Two sectors that experienced more rapid job creation were wholesale/retail trade and, to the surprise of many, local government (aside from local education). What does this imply? The slowdown in job creation was broad based, reflecting a slowdown in the overall economy.
About half of the jobs created were in 2 industries: temp agencies added 25,000 jobs while food services and drinking added 15,000. Local government added 4,000 jobs, but that masks some interesting dynamics. Local education shed 14,000 jobs (seasonally adjusted) while local government added 18,000 jobs in other areas. That builds on the trend from May during which local government eliminated 10,000 education jobs but added 5000 outside of education.
Though there are some problems with seasonal adjustments previously noted, employment growth declined significantly in the second quarter. The chart below shows the growth in jobs by sector in the first and second quarters of 2012, along with the change in the growth (numbers are in thousands):
Industry
|
2012Q1
|
2012Q2
|
Change
|
Total
|
+677
|
+225
|
-452
|
Private
|
+678
|
+274
|
-404
|
Leisure/Hospitality
|
+127
|
+2
|
-125
|
Education
|
+63
|
-56
|
-119
|
Private
Education
|
+40
|
-5
|
-45
|
State
& Local Education
|
+23
|
-51
|
-74
|
Manufacturing
|
+124
|
+30
|
-94
|
Professional/Business
Services
|
+186
|
+106
|
-80
|
Construction
|
+3
|
-40
|
-43
|
Health Care
|
+104
|
+65
|
-39
|
Wholesale/Retail
Trade
|
+21
|
+54
|
+33
|
Local Govt (non-education)
|
-3
|
+29
|
+32
|
Most of the decline in employment growth took place in the private sector (decline of 404,000 compared to 48,000 in government). Leading the slowdown were declines in job creation in leisure & hospitality and education (including both private & public education), each accounting for about 30% of the decline in employment growth. While employment in leisure & hospitality went from robust to flat, education went from adding 63,000 jobs to losing 56,000. Other sectors including manufacturing, professional/business services, and health care continued to add jobs, but at much slower rates while construction went from little growth to shedding jobs. Two sectors that experienced more rapid job creation were wholesale/retail trade and, to the surprise of many, local government (aside from local education). What does this imply? The slowdown in job creation was broad based, reflecting a slowdown in the overall economy.
Subscribe to:
Posts (Atom)