Friday, August 23, 2013

Economic Growth vs. Employment Growth

In March 2012, I posted a discussion of the strength of economic growth relative to employment growth, putting the recent inconsistency in historical context.  Given the recent revisions to economic growth, I decided to update the analysis to see if anything has changed.  Rather than compare economic growth to employment growth, due to the changing mix of employment (increasing proportion of part-time jobs), it's constructive to see how overall output per hour of work (productivity) has behaved over time.  For the overall economy, output is estimated by real GDP while hours worked is estimated using the index of aggregate hours worked index from the monthly labor market report.  The following chart displays the behavior of productivity over the last 50 years:

ALFRED Graph

You'll note that, after surging at the end of the recession/early in the recovery in 2009, productivity has stagnated in recent years.  In fact, from the beginning of 2011 to the end of the second quarter of 2013, productivity growth has averaged -0.3% (reaching a record low of -1.1% in the summer of 2011). Historically, the only time productivity growth tends to be negative is right before or during a recession.  The optimists will point out the one exception: 1993-1995, which preceded the boom of the late 1990s.

From an economic point of view, it's hard to be excited about an economy that is growing at a modest pace accompanied by stagnant productivity.  Historically, there's been a strong correlation between productivity and compensation (income plus fringe benefits earned by workers) as illustrated by the chart below (blue line is productivity and red line is compensation):

ALFRED Graph

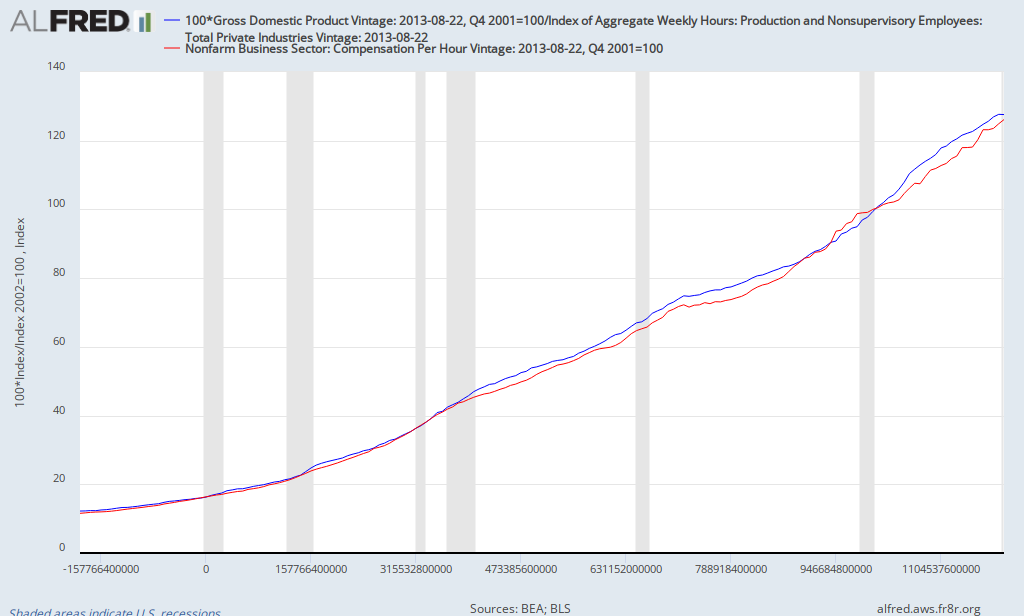
The poor performance of productivity in recent years suggests that one shouldn't expect significant improvements in average compensation (and thus the standard of living) in the near future.

Thursday, August 22, 2013

More on Part-Time vs. Full-Time Employment

In my discussion of the July jobs report, I noted that, according to the government's household survey, 77% of net job creation in 2013 has been in terms of part-time jobs.  The data on part-time employment tends to be volatile, so I decided to look at the long-term trend.  The following chart shows the proportion of part-time jobs in the economy (note: there was a break in the data in 1994, not a surge in part-time employment)

ALFRED Graph

After rising during the 1970s, the percentage of part-time employment tended to be cyclical, rising during recessions and falling during expansions.  It was 17% in 1980 and, after nearly three decades of ups and downs, it was 17% at the start of the Great Recession.  As during previous recessions, it rose from 2007 to 2009, reaching a high of 20% (the largest increase since records started being kept in 1968).  After declining modestly through the end of 2012, it has risen back to 19.6% as of July 2013.
It remains to be seen whether it rises a little more, stabilizes near its current rate, or resumes a slow decline over time.  Regardless, it appears that it will take a long time to return to 17% (if ever).  Why the increase in the ratio of part-time employment?  Regardless which side you take in terms of the relative role of  the weak recovery vs. Obamacare, increasing the cost of full-time employment relative to part-time employment can't help but encourage a greater reliance on part-time jobs.


Saturday, August 3, 2013

July Job Market

Way too much going on recently to post to the blog, but now there's too many things to discuss.  Yesterday, the government released the July employment report and though it showed a decline in the unemployment rate to 7.4%, the underlying details were quite weak.  The headline number indicated that only 162,000 were added, which was less than expected (and gains from previous months were revised downward).  What type of jobs were created?  Retail trade added 46,800 while food and drinkings place added 38,400 (together accounting for a majority of the net jobs created).  That's just for July; what about for 2013 as a whole? Thus far, the economy has added 1.347 million jobs this year, 187,000 of which were in retail trade and 246,500 in food and drinking places.  While these two sectors accounted for 18.5% of all jobs at the start of the year, they account for about one-third of net job creation in 2013 (food and drinking places in particular represented 7.5% of jobs at the beginning of the year, yet was the source of nearly one-in-five new jobs so far in 2013).

According to the household survey, part-time employment accounted for about two-thirds of the jobs created in July.  So far in 2013, part-time employment accounts for 77% of net job creation (note: 20% of all jobs were part time at the beginning of the year).  Since the start of the recession in December 2007, the economy has lost 5.5 million full-time jobs while adding about 3.5 million part-time jobs.  The relative importance of part-time employment helps to explain why total hours worked declined in July even though employment increased (note: this isn't the average work week, but an estimate of total hours worked throughout the economy).

Many economists have been trying to reconcile the relatively weak estimates for economic growth with the comparably stronger numbers for employment.  The underlying details of the employment report suggest that both measures of the state of the economy reveal an economy growing modestly (to use the Fed's latest description).