Showing posts with label employment growth. Show all posts

Friday, August 23, 2013

Economic Growth vs. Employment Growth

In March 2012, I posted a discussion of the strength of economic growth relative to employment growth, putting the recent inconsistency in historical context.  Given the recent revisions to economic growth, I decided to update the analysis to see if anything has changed.  Rather than compare economic growth to employment growth, due to the changing mix of employment (increasing proportion of part-time jobs), it's constructive to see how overall output per hour of work (productivity) has behaved over time.  For the overall economy, output is estimated by real GDP while hours worked is estimated using the index of aggregate hours worked index from the monthly labor market report.  The following chart displays the behavior of productivity over the last 50 years:

ALFRED Graph

You'll note that, after surging at the end of the recession/early in the recovery in 2009, productivity has stagnated in recent years.  In fact, from the beginning of 2011 to the end of the second quarter of 2013, productivity growth has averaged -0.3% (reaching a record low of -1.1% in the summer of 2011). Historically, the only time productivity growth tends to be negative is right before or during a recession.  The optimists will point out the one exception: 1993-1995, which preceded the boom of the late 1990s.

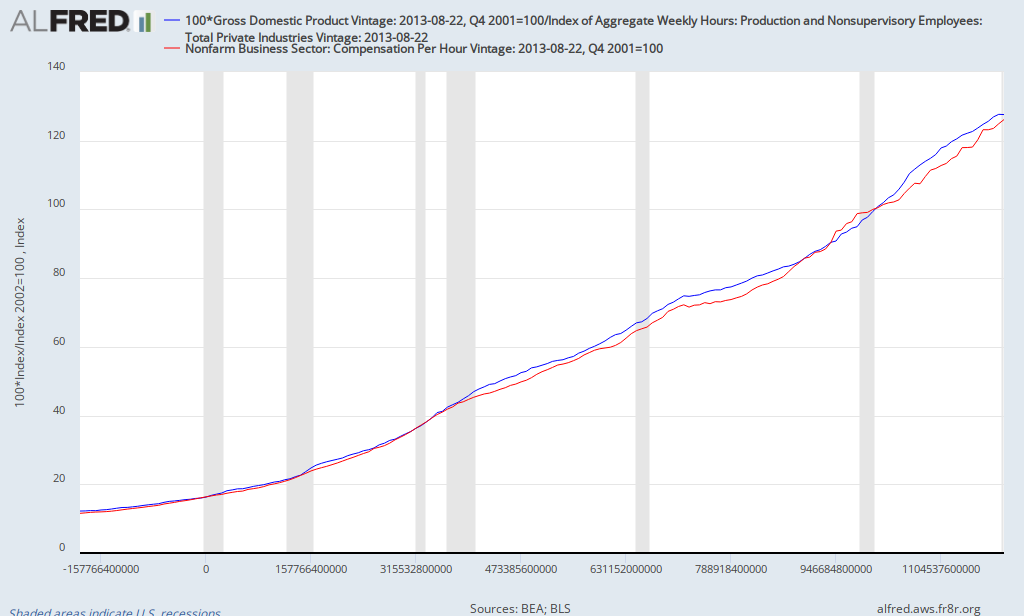
From an economic point of view, it's hard to be excited about an economy that is growing at a modest pace accompanied by stagnant productivity.  Historically, there's been a strong correlation between productivity and compensation (income plus fringe benefits earned by workers) as illustrated by the chart below (blue line is productivity and red line is compensation):

ALFRED Graph

The poor performance of productivity in recent years suggests that one shouldn't expect significant improvements in average compensation (and thus the standard of living) in the near future.

Friday, June 7, 2013

May Employment Report

The headlines from the May employment report are that the unemployment rate rose to 7.6% while the economy added 175,000 jobs (178,000 in the private sector).  But what about the underlying details?  Nothing that dramatic.  The broad measure of unemployment (U6) declined to 13.8% while the labor force participation rate rose to 63.4% (from a 34-year low of 63.3%).  Aggregate hours worked, which had declined in April, rose in May.  All of these numbers are mildly positive.  Where was the job growth?  Food services and drinking places added 38,100 jobs, retail trade added 27,700 and temp agencies added 25,600.  Together, these three sectors represent about 20% of all jobs, but more than half of net job creation in May (and April); they are also relatively low-paying sectors of the economy.  That is one reason why average hourly earnings were flat this month.

What else can we learn from this report?  Since May 2012, the unemployment rate has declined from 8.2% to 7.6%.  However, the unemployment rate rose for teenagers as well as those in their early 20s while the largest declines occurred for those above the age of 55 and those between 25 and 34.  As can be seen in the chart below, the unemployment rate is inversely related to age:


Age
Unemployment Rate
16-19
24.5%
20-24
13.2%
25-34
7.2%
35-44
6.2%
45-54
5.9%
55+
5.3%

What's the key takeaway from the report?  The job market continues to heal at a modest rate, with disproportionate employment growth in relatively low-paying occupations. 

Friday, February 1, 2013

January Employment Report

The January employment report was released this morning and it contained pretty good news about the job market.  The headline numbers showed that employment rose by 157,000 in January (private employment rose by 166,000) while the unemployment rate rose to 7.9%.  Once one digs into the details, the news is mixed but generally positive.  First, employment for November and December was revised up by 127,000.  Given the revisions, the economy added 181,000 jobs per month, on average, for 2012.  The strength of the job market is reassuring given the weak GDP report.

The household survey was not quite as positive as the establishment survey (the establishment survey is generally regarded as superior when assessing the growth in employment).  Not only did the unemployment rate increase slightly (back to where it stood in October 2012, but down from 8.3% in January 2012) while the employment-population ratio remained at 58.6% (up 0.1% from a year ago).  This continues the pattern of moderate employment growth, enough to accomodate growth in the labor force, but not much more (note: the participation rate didn't change and is down by 0.1% over the last 12 months).  On a related note, the broad measure of unemployment (U6) was unchanged at 14.4% (down from 15.1% one year ago and from the peak of 17.1% in late 2009/early 2010).

Though employment rose in terms of the number of job holders, hours worked was flat to negative in many sectors, with the exception of education and health services.  Average hourly earnings were up slightly in January and now have risen 2.1% over the last 12 months, slightly ahead of inflation (which is about 1.5% according to the latest figures).

What are the takeaways?  Despite the weakness of the GDP report (even after removing the effect of inventories), employment growth remains moderate, countering fears of a possible recession.  The recent trend in employment suggests an economy growing closer to 2% than 0%.  Optimists will point to the upward revisions in employment for late 2012 while pessimists will point to sluggish employment gains that are not strong enough to make a dent in the unemployment rate.  For further analysis, though I haven't looked at it yet, I'm counting on Bill McBride of calculated risk to provide solid analysis of the job report.