The latest snapshot of the state and local job market was released this morning, showing unemployment declining to 6.4% in Florida (seasonally adjusted) and 5.8% in Metro Orlando (not seasonally adjusted). In both cases, the rates were the lowest since 2008. Does that mean that unemployment is no longer much of an issue in Florida? While the job market has improved, readers of this blog can probably guess what I'm going to say next. A major reason for the decline in the Florida unemployment rate over the last year has been the decline in the labor force participation rate, which fell from 60.5% in November 2012 to 59.6% in November 2013 (after already falling quite a bit in prior years). If the participation rate had remained steady over the last 12 months, the unemployment rate would be about 7.7%, a small decline from last November's 8%. Though employment growth was modest in November (net increase of 6100 jobs, nearly 60% of which were in retail trade), that's coming off of two strong months of job growth in which the state economy added nearly 69,000 jobs.
Metro Orlando's unemployment rate declined as well, but some of it reflects seasonal issues (the local data released today are not seasonally adjusted) and some of it is likely due to a lower participation rate. That said, there is real improvement in the local job market, but not as much as implied in the official figures. Employment growth in both Florida and Orlando exceeded the national average over the last 12 months (2.7% in Orlando, 2.5% in Florida, 1.7% in the US). Leading growth sectors statewide (since Nov 2012) were retail trade and professional/technical services while food/drinking places and ambulatory health care services were the top gainers for Orlando over the last 12 months (though retail trade was responsible for half of the employment gains in November, primarily due to seasonal issues, i.e., Christmas!).
What are the key takeaways from this morning's report about the state and local job market? Both continue to improve, but the improvement is somewhat overstated due to fewer people participating in the job market (if you're no longer participating in the job market, you're not counted as unemployed). A relative strengthening of the Florida and Orlando labor markets is evidenced by employment growth statewide and locally exceeding that of the nation (over the last few months as well as the last year).
Friday, December 20, 2013
Wednesday, December 18, 2013
Fed Begins to Taper
The Fed announced that they will reduce their bond purchases by $10 billion (will now purchase $75 billion per month). It emphasized that future tapering depends on economic data; further tapering will take place if the labor market continues to improve and/or inflation rises from its current low rate. At the same time, it stated that the "Committee now anticipates, based on its assessment of these factors (labor market, inflation, financial developments), that it likely will be appropriate to maintain the current target range for the federal funds rate well past the time that the unemployment rate declines below 6-1/2 percent, especially if projected inflation continues to run below the Committee's 2 percent longer-run goal" (words in italics added for clarification). This represents a change from previous statements in which it stated that 6.5% unemployment was its threshold (though not a trigger, as emphasized by Ben Bernanke). In other words, previous statements said that the federal funds rate wouldn't be raised until unemployment declined to at least 6.5%. However, the unemployment rate has fallen more quickly than expected, not because of a very strong job market, but due in part to a declining labor force participation rate. Thus, the unemployment rate by itself is not the best gauge of the labor market. In the statement released today, the Fed stated that it will consider various measures of the labor market, not just the unemployment rate. Prior to today, most economists expected the Fed to begin to raise the federal funds rate in 2015. What about now? According to projections released by the Fed today, most members of the Fed still anticipate that the federal funds rate will begin to increase in 2015.
What's the key takeaway? The Fed thinks that the economy is strong enough to begin to reduce the amount of stimulus, though it still needs significant stimulus. It thinks that the recent decline in inflation is temporary and that inflation will increase somewhat in the next year or two (so deflation is not a serious threat). Though it changed the wording of the unemployment threshold leading to an increase in the federal funds rate, this is expected to have little impact on the timing of the increase.
Tuesday, December 10, 2013
The Latest Economic Reports: GDP and Employment
The government released two economic reports last week which, on the surface, indicates that the economy was strengthening in the second half of 2013. Of course there's more to it than that. Economic growth for the third quarter was revised up to 3.6% (from an initial report of 2.8%). Does that mean growth and demand were picking up? Not quite. About half of the growth for the quarter was due to an increase in inventories; final sales rose by 1.9% (in line with the previous trend). In fact, both consumer spending and business investment increased at a slower rate in the third quarter compared to the second quarter. This was offset somewhat by somewhat faster growth in state/local government spending. Also, another measure of economic growth, gross domestic income, rose by 1.4% in the third quarter (after growing more quickly than GDP in recent quarters). What does this mean? More of the same. The recent trend in economic growth has been about 2%.
The other major economic news was the November Employment report, which showed an increase of 203,000 jobs with the unemployment rate falling to 7%. Is this good news? Yes, but not as good as it appears on the surface. If you have read this blog before, you probably know what's coming next. The main reason for the decline in the unemployment rate in recent months (and recent years) is the decline in the participation rate (a smaller portion of the population participating in the job market). The participation rate fell from 63.2% in September to 63% in November (was 62.8% in October). If it had remained at 63.2%, the unemployment rate would have been 7.3% in November (a slight increase rather than a decline of 0.2%). The quality of the jobs added appeared to improve somewhat in November compared to previous months, with a higher portion of jobs in relatively high-paying industries such as construction and manufacturing and a smaller share in relatively low-paying industries compared to previous months.
Together, the two reports suggest that the economy continues to grow at a modest pace: an underlying growth rate of 2% with about 200,000 jobs per month.
Friday, November 8, 2013
October Job Market Report and More
So much has happened since the last time I was able to post. The latest job market report was released this morning and it indicated that 204,000 jobs were added last month while the unemployment rate ticked up to 7.3%. What impact did the government shutdown have? It had little direct effect on the number of jobs created (based on the establishment survey) since government workers were either back on the job or counted as on the payroll since they were promised back pay. However, government workers on furlough were counted as unemployed based on the household survey (those who were contacted said either that they were on temporary layoff or absent from work). Beneath the surface, there was quite a few interesting details (interesting by economic standards!).
The labor force participation rate plummeted to 62.8% (from 63.2%); that's the lowest since March 1978 and tied for the largest one-month decline in the last 30 years. Similarly, the employment-population ratio fell from 58.6% to 58.3%, now just 0.1% above the post-recession low. Some of the decline in the employment-population ratio was due to furloughed government workers, but this should not have affect the labor force participation rate. A person is considered to be in the labor force if they have a job or if they are unemployed, including on temporary layoff or absent from work. It'll be interesting to see if there was some fluke in the data or if this actually does represent a decline in the true participation rate. As noted in the past, a lower participation rate results in a lower unemployment rate without any real improvement in the job market (a person is not considered to be unemployed if they are not participating in the job market; i.e., they don't have a job and are not looking for one). I tend to think that the participation rate was underestimated this month, causing it to bounce back somewhat next time.
What industries contributed to the employment gains? Nearly half the job gains in October were due to retail trade and leisure/hospitality. Over the last 3 months (July-October), nearly 40% of job gains in the private sector were in those two industries.
Add it up and it was a pretty good report by today's standards (definitely not a strong report, but reflective of modest to moderate growth). The most puzzling aspect is the huge decline in the participation rate, which is hard to explain at first glance.
Wednesday, September 18, 2013
No Taper in September
To the surprise of many, the Fed decided not to begin tapering QE3 at its meeting today. Personally, I expected a modest taper of $10 billion (in other words, it would start purchasing $75 billion worth of Treasuries and mortgage-backed securities each month instead of $85 billion). What happened? I think many on the Fed had been concerned about excessive leverage and speculation in the system as evidenced by record-low long-term interest rates, record low interest rates on high-yield bonds, etc. Once the possibility of tapering began to be discussed, there was an unwinding of risk in financial markets (higher long-term interest rates (including mortgage rates), interest rates on high-yield bonds, etc.). Since this mission was accomplished, even more than what the Fed had expected, the Fed could turn its focus back to the economy. As discussed in previous posts, the economy is growing at a modest pace and there is question as to how much the spike in interest rates will affect economic growth in the coming months. Together with continued low inflation, the Fed felt comfortable delaying tapering until at least its next meeting.
Was this the correct move? It's debatable (I would have voted to taper a little). Hopefully it'll provide further stimulus to the housing market and the rest of the economy without reigniting excessive speculation; only time will tell. Financial markets have responded by increasing stock prices and oil prices by more than 1% (compared to before the announcement) while driving down the yield on the 10-year bond by about 0.2% (as of 3pm on September 18).
What's the Fed's outlook for the economy in the coming years? Here's a link to its latest forecast.
Friday, September 6, 2013
August Employment Report
The headline numbers from today's report on the job market are that the unemployment rate declined to 7.3% and the economy added 169,000 jobs. Beneath the surface, the report shows some weakness. Job growth for June and July were revised down by more than 70,000; employment growth has averaged 148,000 per months over the last 3 months (just under 158,000 in the private sector). Nearly one-third of net jobs created over the last 3 months have been in retail trade and 2/3 have been in retail trade, food/drinking places, temp jobs, and home health services (relatively low paying jobs).
Why did the unemployment rate decline? The labor force participation rate fell to 63.2%, the lowest since the summer of 1978. A major reason for the decline is that, for men over the age of 20, the participation rate declined by 0.3% to 72.3%, the lowest since records started being kept in 1948 (the participation rate didn't change for adult women). The employment-population ratio declined slightly to 58.6%, which is where it began 2013 (and 2012). As with the participation rate, the employment-population ratio declined significantly while it rose slightly for adult women. What about part-time vs. full-time jobs? There was a shift from part-time to full-time employment last month (modest increase in full-time jobs, noticeable decline in those working part time for economic reasons), but 60% of net jobs created in 2013 are still estimated to be part time.
Add it up and the job market is improving modestly (not as strong as some were thinking). On a positive note, the ISM service index for August was very strong and auto sales have risen to the highest level since 2007. On the flip side, it remains to be seen how much a drag the recent spike in interest rates will have on the economy. So how's the economy doing? Modest growth in terms of output (GDP) and jobs with some preliminary signs of a possible pickup in the coming months.
Friday, August 23, 2013
Economic Growth vs. Employment Growth
In March 2012, I posted a discussion of the strength of economic growth relative to employment growth, putting the recent inconsistency in historical context. Given the recent revisions to economic growth, I decided to update the analysis to see if anything has changed. Rather than compare economic growth to employment growth, due to the changing mix of employment (increasing proportion of part-time jobs), it's constructive to see how overall output per hour of work (productivity) has behaved over time. For the overall economy, output is estimated by real GDP while hours worked is estimated using the index of aggregate hours worked index from the monthly labor market report. The following chart displays the behavior of productivity over the last 50 years:

You'll note that, after surging at the end of the recession/early in the recovery in 2009, productivity has stagnated in recent years. In fact, from the beginning of 2011 to the end of the second quarter of 2013, productivity growth has averaged -0.3% (reaching a record low of -1.1% in the summer of 2011). Historically, the only time productivity growth tends to be negative is right before or during a recession. The optimists will point out the one exception: 1993-1995, which preceded the boom of the late 1990s.
From an economic point of view, it's hard to be excited about an economy that is growing at a modest pace accompanied by stagnant productivity. Historically, there's been a strong correlation between productivity and compensation (income plus fringe benefits earned by workers) as illustrated by the chart below (blue line is productivity and red line is compensation):
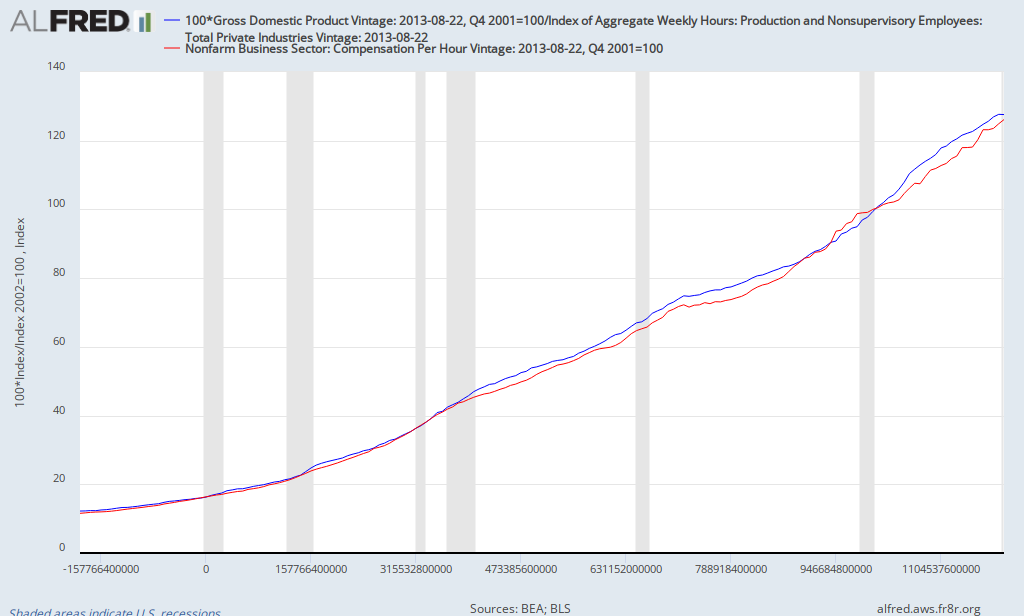
The poor performance of productivity in recent years suggests that one shouldn't expect significant improvements in average compensation (and thus the standard of living) in the near future.
You'll note that, after surging at the end of the recession/early in the recovery in 2009, productivity has stagnated in recent years. In fact, from the beginning of 2011 to the end of the second quarter of 2013, productivity growth has averaged -0.3% (reaching a record low of -1.1% in the summer of 2011). Historically, the only time productivity growth tends to be negative is right before or during a recession. The optimists will point out the one exception: 1993-1995, which preceded the boom of the late 1990s.
From an economic point of view, it's hard to be excited about an economy that is growing at a modest pace accompanied by stagnant productivity. Historically, there's been a strong correlation between productivity and compensation (income plus fringe benefits earned by workers) as illustrated by the chart below (blue line is productivity and red line is compensation):
The poor performance of productivity in recent years suggests that one shouldn't expect significant improvements in average compensation (and thus the standard of living) in the near future.
Thursday, August 22, 2013
More on Part-Time vs. Full-Time Employment
In my discussion of the July jobs report, I noted that, according to the government's household survey, 77% of net job creation in 2013 has been in terms of part-time jobs. The data on part-time employment tends to be volatile, so I decided to look at the long-term trend. The following chart shows the proportion of part-time jobs in the economy (note: there was a break in the data in 1994, not a surge in part-time employment)
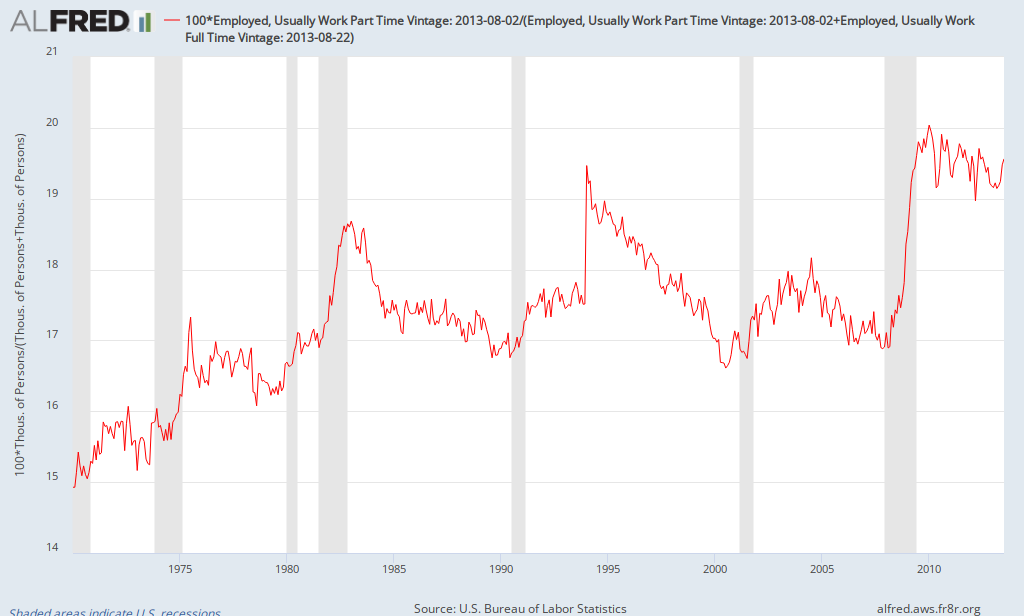
After rising during the 1970s, the percentage of part-time employment tended to be cyclical, rising during recessions and falling during expansions. It was 17% in 1980 and, after nearly three decades of ups and downs, it was 17% at the start of the Great Recession. As during previous recessions, it rose from 2007 to 2009, reaching a high of 20% (the largest increase since records started being kept in 1968). After declining modestly through the end of 2012, it has risen back to 19.6% as of July 2013.
It remains to be seen whether it rises a little more, stabilizes near its current rate, or resumes a slow decline over time. Regardless, it appears that it will take a long time to return to 17% (if ever). Why the increase in the ratio of part-time employment? Regardless which side you take in terms of the relative role of the weak recovery vs. Obamacare, increasing the cost of full-time employment relative to part-time employment can't help but encourage a greater reliance on part-time jobs.
Saturday, August 3, 2013
July Job Market
Way too much going on recently to post to the blog, but now there's too many things to discuss. Yesterday, the government released the July employment report and though it showed a decline in the unemployment rate to 7.4%, the underlying details were quite weak. The headline number indicated that only 162,000 were added, which was less than expected (and gains from previous months were revised downward). What type of jobs were created? Retail trade added 46,800 while food and drinkings place added 38,400 (together accounting for a majority of the net jobs created). That's just for July; what about for 2013 as a whole? Thus far, the economy has added 1.347 million jobs this year, 187,000 of which were in retail trade and 246,500 in food and drinking places. While these two sectors accounted for 18.5% of all jobs at the start of the year, they account for about one-third of net job creation in 2013 (food and drinking places in particular represented 7.5% of jobs at the beginning of the year, yet was the source of nearly one-in-five new jobs so far in 2013).
According to the household survey, part-time employment accounted for about two-thirds of the jobs created in July. So far in 2013, part-time employment accounts for 77% of net job creation (note: 20% of all jobs were part time at the beginning of the year). Since the start of the recession in December 2007, the economy has lost 5.5 million full-time jobs while adding about 3.5 million part-time jobs. The relative importance of part-time employment helps to explain why total hours worked declined in July even though employment increased (note: this isn't the average work week, but an estimate of total hours worked throughout the economy).
Many economists have been trying to reconcile the relatively weak estimates for economic growth with the comparably stronger numbers for employment. The underlying details of the employment report suggest that both measures of the state of the economy reveal an economy growing modestly (to use the Fed's latest description).
Friday, July 5, 2013
June Employment Report
The headlines of the June employment report are that the economy added 195,000 jobs and the unemployment report remained at 7.6%. Beneath the surface, the report is generally good (by today's standards!). Revisions show an extra 70,000 jobs created in April and May than previously estimated (employment is now up 2.3 million over the last 12 months). Also, the participation rate rose slightly to 63.5%. Average weekly wages rose by 0.4% (strong for one month) and is up 2.2% over the last year (not as strong, but OK). Which industry added the most jobs? Food services and drinking places added nearly 52,000 in June and almost 100,000 over the last two months. Other industries adding jobs include "amusement, gambling, and recreation," which added about 19,000 jobs in June and over 40,000 in the last two months. Housing and auto-related industries (construction, auto manufacturing, retailers related to housing and autos, ...) added just over 35,000 jobs. Local government employment (other than education) rose by 15,000 and is now up by more than 25,000 since June 2012.
What are the negatives in the report? The broad measure of unemployment (U6) rose from 13.8% to 14.3% (the largest increase since Spring 2009) due to a surge in the number of people working part time for economic reasons. Both figures reversed declines from earlier this year. The number of people working part time for economic reasons are now higher than a year ago while U6 is close to where it was at the beginning of the year (and last Fall). Also, as noted earlier, a disproportionate number of jobs are in relatively low paying industries, such as food services and drinking places, though less than in prior months.
What are the key takeaways? The job market is relatively strong (OK by historical standards, but strong compared to recent history), adding just under 200,000 jobs a month for the last 3 months (many in low-paying industries). This contrasts with economic growth, which has been quite weak in the last 9 months (0.4% in 2012Q4, 1.8% in 2013Q1, and forecasted to be around 1.5% in 2013Q2). How are financial markets reacting to the new data? As of 9am Friday morning, ten-year bond yields are now about 2.7%, the highest since July 2011, reflecting in part concerns as to how a strengthening job market will affect the Fed's timetable in tapering QE3.
Saturday, June 29, 2013
Some thoughts on the Fed, QE3, and Financial Markets
Let's take a look back at some of the economic news from this week. First, in response to some turmoil in financial markets, several members of the FOMC tried to clarify the remarks Ben Bernanke made following the Fed's most recent meeting while some commentators complained that Bernanke was not clear and the Fed had a communication problem. Fed members said what Bernanke meant was that the Fed plans to begin reducing QE3 (tapering) once the economy strengthens further, using a 7% unemployment rate as a guidepost. Tapering isn't immediate, but would probably begin later this year, assuming Fed forecasts turn out to be correct, and QE3 will completely end next year. They emphasized that it's data dependent, so if the economy is weaker than expected, QE3 would continue for a longer period of time. They also emphasized that tapering shouldn't be confused with an increase in the federal funds rate, which is unlikely until 2015. How does this differ from what Bernanke said (see previous post)? What he said was basically:
The Fed plans to begin reducing QE3 (tapering) once the economy strengthens further, using a 7% unemployment rate as a guidepost. Tapering isn't immediate, but would probably begin later this year, assuming Fed forecasts turn out to be correct, and be QE3 would completely end next year. It's data dependent, so if the economy is weaker than expected, QE3 would continue for a longer period of time. Tapering shouldn't be confused with an increase in the federal funds rate, which is unlikely until 2015.
If you can't tell the difference, that's OK; they just repeated what Bernanke had already said. From my perspective, it was hard to misinterpret Bernanke (there must have been some hidden signal; saying that rates would rise in 2015 probably meant 2014, ...). Why didn't the Fed just say tapering would begin in September (or December) and QE3 would end in June 2014? Because QE3 is designed to strengthen the economy and reduce unemployment. If it needs to be in place a little longer to achieve the goal, it'll be extended (tapering beginning in 2014 instead of late 2013, etc.). So making tapering of QE3 dependent on the state of the economy makes perfect sense. As a reminder, I'm a skeptic of QE3 (see here and here), so I'm not defending the policy.
So why did markets react they way they did to Bernanke's hints in May and his remarks following the most recent Fed meeting? First, let me point you to a post prior to the Fed's meeting about rising real interest rates. Since QE3 involves Fed purchases of bonds, some investors thought it would be a good idea to buy the bonds before the Fed did (since demand from the Fed would increase bond prices, it makes sense to buy the bonds first so you can benefit from the price increase). Also, negative real interest rates caused many investors to seek better returns in riskier assets. Once the reality sunk in that QE3 wouldn't go on forever and interest rates started to increase, these trades reversed. As a result, interest rates spiked and asset prices declined, particularly on riskier assets such as emerging markets. I don't think this represented investors thinking that the Fed going to end QE3 immediately or increase the federal funds rate soon, but instead represented the unwinding of speculation. There's a lot less speculative excesses in financial markets now compared to a month ago, which is a good thing for the future (makes new bubbles less likely).
What is the likely impact of the spike in interest rates on the economy? That will be addressed in a future post. What's the key takeaway from what's happened in financial markets in recent weeks? In an era of record low interest rates (near zero on safe assets), many investors took on greater risk than they would normally prefer in order to achieve a higher return. The reality of QE3 ending at some point in the foreseeable future along with the subsequent increase in real interest rates caused investors to better appreciate the riskiness of their investments, which is a good thing over time (though it may hurt in the short run).
Friday, June 21, 2013
May Employment Report: Florida and Orlando
The latest report about the job market in Florida and its localities was released this morning. The headlines are that the unemployment rate for Florida is 7.1%, the lowest since September 2008. Is the job market as good as it was back then? Not quite. Though progress has been made in recent years, we are still a long way from 2008. Florida is still down 137,000 jobs since September 2008 and has about 550,000 fewer jobs than before the recession. How has the unemployment rate declined so much even though employment is still lagging? The labor force participation rate has declined from about 64% before the recession to 60.3% in May 2013. Thus, most of the decline in the unemployment rate in recent years has been due to a smaller percentage of people participating in the job market.
What sectors have experienced the strongest employment growth in the last year? Interest-sensitive sectors - housing and autos. Areas with the fastest employment growth include construction, auto dealers, building supply stores, and real estate. In terms of absolute numbers, food and drinking places added the most jobs statewide over the last year, up 26,700. What about the most recent month? Florida actually lost jobs, mainly due to a decline on construction, which gave back some of its recent gains.
Unlike statewide, the data released today for metropolitan areas were not seasonally adjusted. Orlando showed no change in employment while the unemployment rate ticked up a little, to 6.6%. The seasonally-adjusted unemployment rate will be released in a few weeks and will likely indicate little change in the unemployment rate (close to 6.9%; this estimate is based on historical seasonal adjustments). Over the last year, a majority of the jobs created locally have been in leisure and hospitality (8500 out of 16,800), led by food and drinking places, the fastest growing category over the last 12 months (up 6%).
What are the key takeaways from today's report? The Florida economy continues to heal, but employment growth remains modest. The rate of employment growth in Orlando, Florida and the United States were roughly equal at about 1.6 to 1.7% over the last year.
Wednesday, June 19, 2013
The Fed's Latest Announcement Regarding the Direction of Monetary Policy
As expected, the Fed announced this afternoon that it will continue QE3 without tapering, for now. In addition, it released its latest forecasts for the economy. What are the headlines? During the press conference following the announcement, Ben Bernanke said that, if the Fed forecast turns out to be correct, the Fed will probably begin tapering its purchases of bonds later this year and end QE3 by mid-2014. Also, a large majority of FOMC participants anticipate the federal funds rate beginning to increase in 2015. The initial response of the market has been a sharp decline in stocks and a significant increase in interest rates with the ten-year bond rising to 2.33%, the highest since March 2012.
Let's take a closer look at the Fed's view of the economy. First, it should be noted that the projections are those of each of the 12 district banks, not the Federal Reserve itself (i.e., not the Board of Governors or Ben Bernanke). The table below show the central tendency of the forecasts, which is the range of forecasts after eliminating the 3 highest and 3 lowest forecasts for each variable.
note: the forecast for the unemployment rate is for the end of the year
In addition to the forecasts, the Fed noted that it thinks the downside risks to the economy have subsided (less risk of a slowdown). The forecast for economic growth for all 3 years is somewhat more optimistic than that of most private forecasts, but the other forecasts are in line with other forecasts. What are the implications for monetary policy? The Fed has announced thresholds (their word, not mine) for inflation (forecast above 2.5%, 1-2 years in the future; it relies on a forecast of inflation since it takes time for monetary policy to impact inflation) and the unemployment rate (6.5%) for when they are likely to consider increasing the federal funds rate. Today, Ben Bernanke suggested that QE3 would likely end as the unemployment rate reached 7%. Given that the Fed expects the unemployment rate to reach 7% in Spring/Summer 2014, QE3 will likely end around that time (if their forecast is correct). Since it will preceded by a gradual reduction in bond purchases, the tapering will likely begin in late 2013. Ben Bernanke emphasized that if the data shows a slower economy (including a higher than expected unemployment rate), QE3 could be extended further into 2014 (and thus tapering may not start until sometime in 2014).
What are the key takeaways from the latest news from the Fed? It is more confident about the strength of the economy, but still thinks it requires stimulus. In addition, it provided some clarification as to when it would begin to taper and eventually end QE3, though the exact timing is dependent on the data. As of now, it expects that tapering will begin later this year with QE3 coming to an end by this time next year.
Let's take a closer look at the Fed's view of the economy. First, it should be noted that the projections are those of each of the 12 district banks, not the Federal Reserve itself (i.e., not the Board of Governors or Ben Bernanke). The table below show the central tendency of the forecasts, which is the range of forecasts after eliminating the 3 highest and 3 lowest forecasts for each variable.
|
|
2013
|
2014
|
2015
|
|
Economic growth
|
2.3 to 2.6%
|
3 to 3.5%
|
2.9 to 3.6%
|
|
Unemployment rate
|
7.2 to 7.3%
|
6.5 to 6.8%
|
5.8 to 6.2%
|
|
inflation
|
0.8 to 1.2%
|
1.4 to 2%
|
1.6 to 2%
|
In addition to the forecasts, the Fed noted that it thinks the downside risks to the economy have subsided (less risk of a slowdown). The forecast for economic growth for all 3 years is somewhat more optimistic than that of most private forecasts, but the other forecasts are in line with other forecasts. What are the implications for monetary policy? The Fed has announced thresholds (their word, not mine) for inflation (forecast above 2.5%, 1-2 years in the future; it relies on a forecast of inflation since it takes time for monetary policy to impact inflation) and the unemployment rate (6.5%) for when they are likely to consider increasing the federal funds rate. Today, Ben Bernanke suggested that QE3 would likely end as the unemployment rate reached 7%. Given that the Fed expects the unemployment rate to reach 7% in Spring/Summer 2014, QE3 will likely end around that time (if their forecast is correct). Since it will preceded by a gradual reduction in bond purchases, the tapering will likely begin in late 2013. Ben Bernanke emphasized that if the data shows a slower economy (including a higher than expected unemployment rate), QE3 could be extended further into 2014 (and thus tapering may not start until sometime in 2014).
What are the key takeaways from the latest news from the Fed? It is more confident about the strength of the economy, but still thinks it requires stimulus. In addition, it provided some clarification as to when it would begin to taper and eventually end QE3, though the exact timing is dependent on the data. As of now, it expects that tapering will begin later this year with QE3 coming to an end by this time next year.
Monday, June 17, 2013
Recent Trends in Income for Florida and Orlando
Last week, the Bureau of Economic Analysis (BEA) released the latest estimates for state and metropolitan personal income (overall and per capita; both figures in real terms; i.e., adjusted for inflation). I exchanged a series of emails with a reporter from the Orlando Sentinel, but only a very small portion was included in the story, so I decided to include more of the details in this post.
After declining by nearly 7% in 2009, real personal income in Florida is recovering (up 3.7% in 2010 and 2.2% in 2011, the latest year for which data are available). As of 2011, it was still below where it had been in 2007. Likewise, real personal income per capita (i.e., real personal income divided by population, not the same as income per worker) is slowly recovering from a steep decline in 2009 (down 7.5% in 2009, up 2.7% and 1% in 2010 and 2011, respectively). As of 2011, it was still down just over 5% from 2007. Inflation in Florida was slightly lower than the US as a whole, averaging 1.6% from 2007-2011 compared to 1.9% for the US.
The performance of Metro Orlando mirrored that of the state as real personal income rose 3.4% and 2.7% in 2010 and 2011, respectively, while real personal income per capita rose by 2.1% and 1.2%. The ratio of real personal income per capita in Orlando compared to the nation as a whole remained steady from 2009-2011 at about 87%.
How does Orlando compare to other metropolitan areas in Florida? Here's a table comparing some of the metropolitan areas in Florida.
Per capita Income by Metropolitan Area: overall and by Type for 2011
note: add rows 2-4 to get row 1; data are not inflation adjusted
The headline number shows Orlando lagging behind other metro areas, but the reason is somewhat surprising. While earnings explain some of the underperformance, the major reason is weakness in dividends, interest, and rental income. For example, while earnings per capita are higher in Orlando than Tampa, personal income per capita is 10% higher in Tampa due to higher dividends/interest/rent and higher transfer payments. Earnings in Orlando also lag behind Jacksonville and Miami, but once again, the other forms of income, particularly dividend/interest/rent, play a more significant role.
What explains the relatively low level of dividends/interest/rent in Orlando? One possible reason is a smaller amount of wealth due in part to a younger population. The median age in Orlando is 33 compared to 39 in Miami and 35 in both Jacksonville and Tampa (different sources provide slightly different estimates). Other factors also play a role, but that's a subject for another day.
What are the key takeaways? Income in Florida is slowly recovered from the damage suffered during the Great Recession. Also, differences in per capita income reflect not only differences in earnings but also in unearned income, including income from wealth and government transfer payments.
After declining by nearly 7% in 2009, real personal income in Florida is recovering (up 3.7% in 2010 and 2.2% in 2011, the latest year for which data are available). As of 2011, it was still below where it had been in 2007. Likewise, real personal income per capita (i.e., real personal income divided by population, not the same as income per worker) is slowly recovering from a steep decline in 2009 (down 7.5% in 2009, up 2.7% and 1% in 2010 and 2011, respectively). As of 2011, it was still down just over 5% from 2007. Inflation in Florida was slightly lower than the US as a whole, averaging 1.6% from 2007-2011 compared to 1.9% for the US.
The performance of Metro Orlando mirrored that of the state as real personal income rose 3.4% and 2.7% in 2010 and 2011, respectively, while real personal income per capita rose by 2.1% and 1.2%. The ratio of real personal income per capita in Orlando compared to the nation as a whole remained steady from 2009-2011 at about 87%.
How does Orlando compare to other metropolitan areas in Florida? Here's a table comparing some of the metropolitan areas in Florida.
Per capita Income by Metropolitan Area: overall and by Type for 2011
Jacksonville
|
Miami
|
Orlando
|
Tampa
|
|
Personal
income
|
$40,709
|
$43,072
|
$35,535
|
$39,261
|
Personal income
from earnings from work by place of residence
|
$25,837
|
$24,543
|
$22,969
|
$22,201
|
Dividends,
Interest, and Rent
|
$7,712
|
$10,601
|
$5,695
|
$8,810
|
Current
Transfers
|
$7,160
|
$7,928
|
$6,872
|
$8,249
|
The headline number shows Orlando lagging behind other metro areas, but the reason is somewhat surprising. While earnings explain some of the underperformance, the major reason is weakness in dividends, interest, and rental income. For example, while earnings per capita are higher in Orlando than Tampa, personal income per capita is 10% higher in Tampa due to higher dividends/interest/rent and higher transfer payments. Earnings in Orlando also lag behind Jacksonville and Miami, but once again, the other forms of income, particularly dividend/interest/rent, play a more significant role.
What explains the relatively low level of dividends/interest/rent in Orlando? One possible reason is a smaller amount of wealth due in part to a younger population. The median age in Orlando is 33 compared to 39 in Miami and 35 in both Jacksonville and Tampa (different sources provide slightly different estimates). Other factors also play a role, but that's a subject for another day.
What are the key takeaways? Income in Florida is slowly recovered from the damage suffered during the Great Recession. Also, differences in per capita income reflect not only differences in earnings but also in unearned income, including income from wealth and government transfer payments.
Thursday, June 13, 2013
Higher Real Interest Rates
After a period of stability, financial markets have become volatile once again, led by major declines in the stock markets of many emerging markets and Japan. One of the reasons cited is the rise in interest rates (for example, the yield on the ten-year US bond has risen by 0.5% in a short time). What is the bond market telling us? By examining the market for TIPS (Treasury Inflation Protected Securities), we can decompose the rise in bond yields into two components: break-even inflation and the real interest rate. The yield on the TIPS represents the real interest rate (interest rate adjusted for inflation) since investors holding TIPS earn the yield plus are compensated for whatever inflation turns out to be. Break-even inflation is the difference between the yield on a traditional Treasury and the comparable TIPS. Some economists use it as a proxy for expected inflation (technically, one must adjust it for the inflation risk premium to obtain the market's expectation of inflation, but we'll save that for another day).
Why have interest rates risen recently? An increase in real interest rates. Here's a chart of the yield on ten-year TIPS (red line) and break-even inflation (green line) over the last 5 years (daily data):
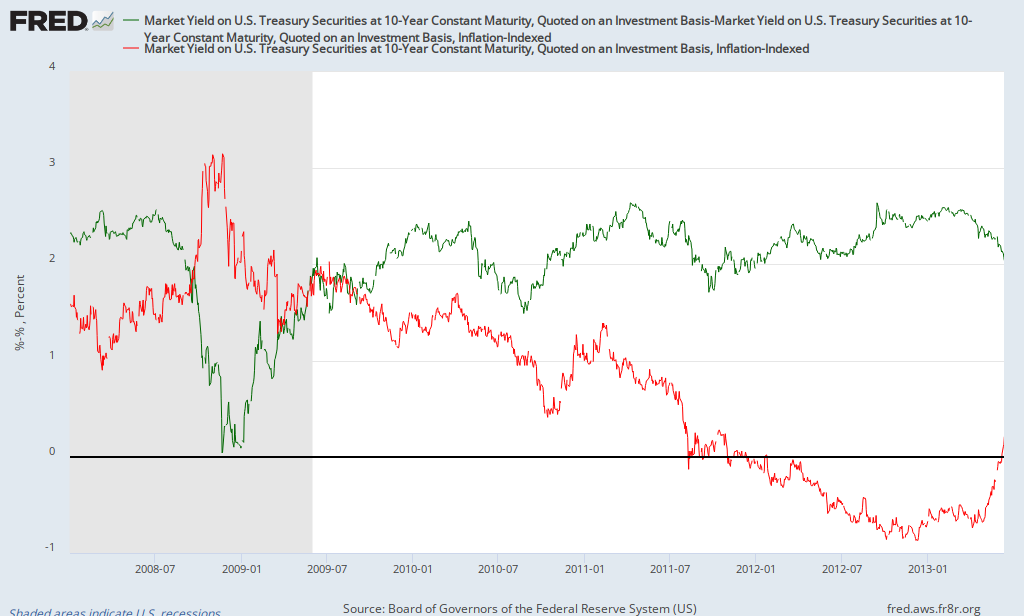
While break-even inflation has declined recently, you'll notice that, after being negative since late 2011, the real interest rate just turned positive in recent days (and has risen significantly over the last month; from -0.68 at the end of April to 0.21 on June 12). What's the significance of the change in real interest rates? Here's an interesting chart of the S&P 500 (blue line) and the real interest rate as estimated by the yield on 10-year TIPS (green line):

Over the last 5 years, the correlation between the S&P500 and the yield on 10-year TIPS is -0.8; a strong negative relationship. The most likely explanation for it is low or negative real interest rates motivate investors to seek better returns elsewhere, including the stock market. Of course there are other factors that are affecting stock prices, but low/negative real interest rates due in part to QE seem to be having a significant impact. It appears that investors are right to be concerned about impact of the Fed scaling back QE. Of course, there's still considerable uncertainty as to when will begin to reduce its bond purchases as well as how quickly it'll phase out QE (will it go from $85 billion a month to $0 in a few months or over a much longer period of time).
In the five years before the financial crisis (June 2003-June 2008), the yield on 10-year TIPS averaged 2%. Though they won't necessarily rise back to that level, if real interest rates continue to normalize (rise somewhat), one can expect continued volatility in financial markets. It should be noted that the correlation between real interest rates and the stock market prior to the crisis (2003-2008) was small and slightly positive, so once real rates stabilize at a higher level, they should cease being a hindrance to the stock market.
Why have interest rates risen recently? An increase in real interest rates. Here's a chart of the yield on ten-year TIPS (red line) and break-even inflation (green line) over the last 5 years (daily data):
While break-even inflation has declined recently, you'll notice that, after being negative since late 2011, the real interest rate just turned positive in recent days (and has risen significantly over the last month; from -0.68 at the end of April to 0.21 on June 12). What's the significance of the change in real interest rates? Here's an interesting chart of the S&P 500 (blue line) and the real interest rate as estimated by the yield on 10-year TIPS (green line):
Over the last 5 years, the correlation between the S&P500 and the yield on 10-year TIPS is -0.8; a strong negative relationship. The most likely explanation for it is low or negative real interest rates motivate investors to seek better returns elsewhere, including the stock market. Of course there are other factors that are affecting stock prices, but low/negative real interest rates due in part to QE seem to be having a significant impact. It appears that investors are right to be concerned about impact of the Fed scaling back QE. Of course, there's still considerable uncertainty as to when will begin to reduce its bond purchases as well as how quickly it'll phase out QE (will it go from $85 billion a month to $0 in a few months or over a much longer period of time).
In the five years before the financial crisis (June 2003-June 2008), the yield on 10-year TIPS averaged 2%. Though they won't necessarily rise back to that level, if real interest rates continue to normalize (rise somewhat), one can expect continued volatility in financial markets. It should be noted that the correlation between real interest rates and the stock market prior to the crisis (2003-2008) was small and slightly positive, so once real rates stabilize at a higher level, they should cease being a hindrance to the stock market.
Friday, June 7, 2013
May Employment Report
The headlines from the May employment report are that the unemployment rate rose to 7.6% while the economy added 175,000 jobs (178,000 in the private sector). But what about the underlying details? Nothing that dramatic. The broad measure of unemployment (U6) declined to 13.8% while the labor force participation rate rose to 63.4% (from a 34-year low of 63.3%). Aggregate hours worked, which had declined in April, rose in May. All of these numbers are mildly positive. Where was the job growth? Food services and drinking places added 38,100 jobs, retail trade added 27,700 and temp agencies added 25,600. Together, these three sectors represent about 20% of all jobs, but more than half of net job creation in May (and April); they are also relatively low-paying sectors of the economy. That is one reason why average hourly earnings were flat this month.
What else can we learn from this report? Since May 2012, the unemployment rate has declined from 8.2% to 7.6%. However, the unemployment rate rose for teenagers as well as those in their early 20s while the largest declines occurred for those above the age of 55 and those between 25 and 34. As can be seen in the chart below, the unemployment rate is inversely related to age:
What's the key takeaway from the report? The job market continues to heal at a modest rate, with disproportionate employment growth in relatively low-paying occupations.
What else can we learn from this report? Since May 2012, the unemployment rate has declined from 8.2% to 7.6%. However, the unemployment rate rose for teenagers as well as those in their early 20s while the largest declines occurred for those above the age of 55 and those between 25 and 34. As can be seen in the chart below, the unemployment rate is inversely related to age:
|
Age
|
Unemployment Rate
|
|
16-19
|
24.5%
|
|
20-24
|
13.2%
|
|
25-34
|
7.2%
|
|
35-44
|
6.2%
|
|
45-54
|
5.9%
|
|
55+
|
5.3%
|
What's the key takeaway from the report? The job market continues to heal at a modest rate, with disproportionate employment growth in relatively low-paying occupations.
Thursday, May 16, 2013
The Shrinking Budget Deficit
Earlier this week, the Congressional Budget Office (CBO) released its latest forecast for the budget deficit for 2013 as well as for the next decade. Depending on one's perspective, there was good news in that the 2013 deficit is now expected to be much lower than previously anticipated, $642 billion or 4% of GDP (down from $1.1 trillion or 7% of GDP in 2012). Why is it expected to shrink so much? Revenue is expected to increase by 15% this year due to the payroll tax hike, higher tax rates on the rich, many upper-income people "realized" more income in late 2012 in anticipation of higher tax rates in 2013, and increased payments to the government from Fannie Mae and Freddie Mac. Here's a chart of the forecasts for revenue and spending as a percent of GDP:

Not only is the deficit expected to shrink significantly this year, but it is expected to decline to $378 billion or 2.1% of GDP in 2015. The publicly-held national debt is expected to peak at 76.2% in 2014, fall to a low of 70.8% in 2018 and then begin to rise again. Does this mean that the budget deficit is no longer a problem?
The CBO also released deficit and debt estimates under an alternative scenario. Why an alternative scenario? The CBO must base its forecasts on current law. That means it must assume that sequestration will continue to be implemented over the next decade, reimbursements to doctors under Medicare will be cut, and some temporary tax provisions will be allowed to expire. Will this happen? It's hard to know for sure, but there's a good chance a lot of it won't. If it doesn't, deficits will be significantly higher (link to excel file with the alternative deficit forecasts). For example, instead of declining to $378 billion in 2015, the deficit would be $577 billion or 3.3% of GDP (almost $200 billion higher). The publicly-held national debt would fall to 75% of GDP in 2017 before rising to 83% in 2023 (compared to 74% in the baseline scenario). Over the decade (2014-2023), the debt would be $2.4 trillion higher under the alternative scenario.
Where does the US stand in terms of the budget deficit and national debt? The budget deficit is falling. Of course policies designed to reduce the deficit cause short-term economic pain (tax hikes, sequestration, ...). Given the progress already achieved in terms of deficit reduction and the continued modest recovery, future efforts should focus on long-term reductions in the deficit (for example, entitlement reform). The baseline forecast assumes that there will be significant cuts in discretionary spending in the years ahead that may be politically difficult (and may not be the best approach to reduce the deficit). If these cuts are not implemented, alternative means of controlling future spending will be necessary (further action will be necessary even if most or all of these cuts are implemented). For further details, see this post from late 2012.
Friday, May 3, 2013
April Employment Report
The government released the April employment report this morning and the big news was upward revisions to job growth in February and March. Employment in February rose more than any non-Census month since November 2005 (up 332,000) while March employment now is reported to have increased by 138,000 instead of 88,000. Instead of last month's story about weakness in the job market, it now appears that employment continues to grow at a moderate pace (138,000 in March, 165,000 in April). Those aren't great numbers, but in line with an economy growing modestly. The other headline number is that the unemployment rate declined to 7.5%, down from 7.6% in March and the participation rate remained stable, so this was due to a real improvement in the job market (though the participation rate is still at a 34-year low).
What industries contributed most to the gains in employment? Food and drinking places (restaurants) added about 38,000 in April, temp agencies added 31,000 and retail trade added 29,000. Add it up and about 60% of the gains were in relatively low-paying industries. The biggest concern in the report was a decline in the aggregate hours worked, which indicates that many of the jobs created were part time (i.e., fewer total hours worked but more employees means that each employee is working less time). Two of the industries showing the largest gain in employment, retail trade and leisure/hospitality, are known to have a large proportion of part-time workers. Using data on average weekly earnings and average hourly earnings (table B-3 of the release), the average worker in retail trade now works about 31.4 hours a week while the average in leisure and hospitality is about 26 hours (both of which declined between March and April).
Even though the economy is adding more jobs than previously estimated (which is definitely good news), the April job report raises questions about the quality of jobs, both in terms of an overabundance of jobs in relatively low-paying industries and a disproportionate number of part-time jobs.
What are the key takeaways? The economy is adding more jobs than previously thought, but employment is still growing at a modest rate. Also, the aggregate hours worked has not kept pace with employment growth. So far this year, employment has increased at a 2.2% annualized rate while aggregate hours worked has risen by only 1.2%.
Friday, April 26, 2013
An Initial Look at First Quarter GDP
The first estimate of first quarter GDP was released this morning and it showed that economic growth was less than the consensus estimate at 2.5% (consensus was about 3%). The good news was that consumption rose by 3.2%, residential investment rose by 12.6%, and exports rose by 2.9%. Why was the report weaker than expected? Business investment rose by only 2.1% and defense spending declined by 11.5% (on top of a 22% decline in the fourth quarter of 2012). After subtracting from growth at the end of 2012, inventories added about 1% to growth in the first quarter; subtracting inventories from GDP means that final sales rose by 1.5% in the first quarter.
How does this affect the outlook for the rest of the year? The sluggishness in business investment indicates that businesses remain cautious and may indicate sluggishness in hiring as well (similar to the March employment report). Though consumer spending grew at a quicker pace than any time since the end of 2010, it's unlikely to continue at that pace, given the expiration of the payroll tax cut at the beginning of this year (other data suggests that it started to hurt consumer spending late in the first quarter and that weakness will show up in the second quarter numbers). On a more positive note, residential investment remains strong and is likely to continue to be the strongest point of the economy for the rest of 2013. Also, it's unlikely that defense spending will continue to fall as quickly and thus will cease to be a drag on growth.
What's the key takeaways? More of the same, but for different reasons. The economy is likely to continue to grow at a modest pace, close to 2%. Consumer spending will constrained by the reduction in disposable income resulting from the increase in the payroll tax. Business investment, after rebounding strongly in 2010-2011, has grown modestly over the last year and is likely to continue on that path. It looks like 2013 will be another year of slow recovery with modest economic growth.
Thursday, April 25, 2013
Progress in Consumer Deleveraging and Housing: How Far We've Come
During the depths of the financial crisis, a few charts made it clear that consumers needed to deleverage and housing prices had to come down considerably from bubble levels. I thought it would be helpful to see how much progress has been made in recent years to get a better idea as to how much further the economy has to go to correct the excesses of the early- to mid-2000s.
The first chart is the Case-Shiller Home Price index from 1890-2012, which shows a housing price index adjusted for inflation:

After moving between 60 and 140 for a century, the index spiked to 220 in late 2005, clearly indicating the existence of a housing bubble. As of late 2012, the index was down to 134.5 and appeared to be stabilizing (even increasing somewhat). Though this is still a little high by historical standards, it is in line with the performance since WW2.
The second chart is the ratio of consumer debt (credit market debt) to disposable income from the early 1950s to the present:
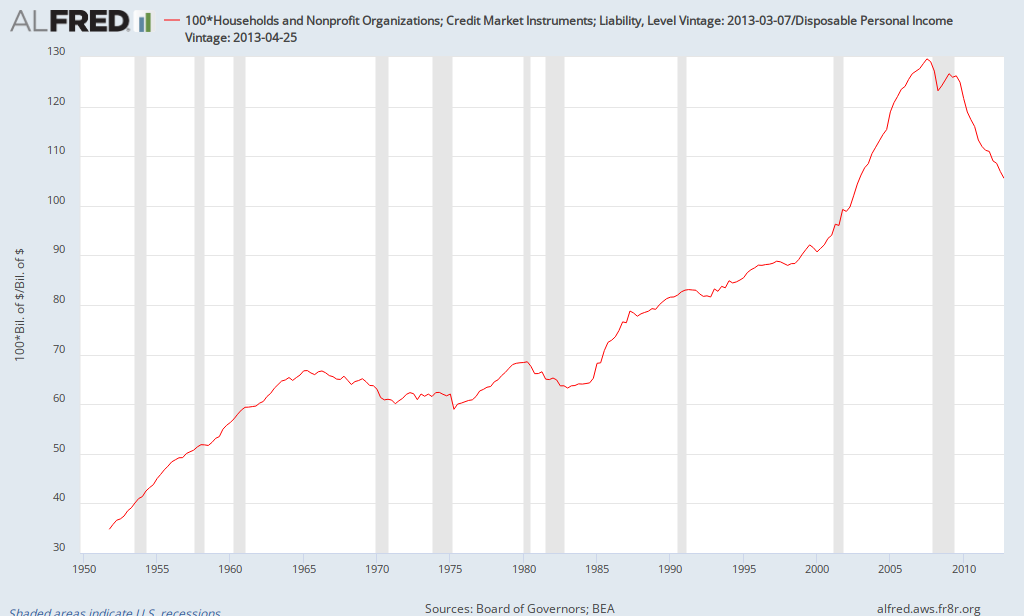
As can be seen, there was an upward trend over time, but the ratio jumped during the 2000s, rising from about 90% at the start of the century to 130% in the summer of 2007. Consumer deleveraging was essential to return to historical trends. As of the end of 2012, it was down to 105%. Though there's not a magic number that indicates deleveraging is complete, much progress has been made and it appears that it is now closer to the upward trend from the late 1980s to 2000. Of course the upward trend from the 1980s and 1990s was probably not sustainable (otherwise the ratio would continue to rise indefinitely). Whether the ratio should be 105% or 100% or..., it appears that most of the deleveraging has already taken place.
Though there are other indicators to consider, it appears that some of the excesses of the bubble era have been corrected, returning closer to historical norms.
The first chart is the Case-Shiller Home Price index from 1890-2012, which shows a housing price index adjusted for inflation:
After moving between 60 and 140 for a century, the index spiked to 220 in late 2005, clearly indicating the existence of a housing bubble. As of late 2012, the index was down to 134.5 and appeared to be stabilizing (even increasing somewhat). Though this is still a little high by historical standards, it is in line with the performance since WW2.
The second chart is the ratio of consumer debt (credit market debt) to disposable income from the early 1950s to the present:
As can be seen, there was an upward trend over time, but the ratio jumped during the 2000s, rising from about 90% at the start of the century to 130% in the summer of 2007. Consumer deleveraging was essential to return to historical trends. As of the end of 2012, it was down to 105%. Though there's not a magic number that indicates deleveraging is complete, much progress has been made and it appears that it is now closer to the upward trend from the late 1980s to 2000. Of course the upward trend from the 1980s and 1990s was probably not sustainable (otherwise the ratio would continue to rise indefinitely). Whether the ratio should be 105% or 100% or..., it appears that most of the deleveraging has already taken place.
Though there are other indicators to consider, it appears that some of the excesses of the bubble era have been corrected, returning closer to historical norms.
Sunday, April 21, 2013
Some Thoughts on the Employment Report for Florida and Metro Orlando
The latest information about the job market in Florida and Orlando was released on Friday. The headline numbers looked good: Florida added nearly 33,000 jobs in March and the unemployment rate fell to 7.5% while the unemployment rate in Orlando declined to 6.6% with employment rising by 3500 (metro data are not seasonally adjusted). Of course it's important to look at the details.
The entire decline in the unemployment rate for Florida was due to a decline in the labor force participation rate, which fell from 60.5% to 60.3%. If the participation had remained constant, the unemployment rate would be 7.8%. In terms of nonfarm payrolls (employment), nearly a third of the jobs were in accommodations and food services. However, a sizeable portion was also in construction, which was the fastest growing sector of the economy. Add it up and it was a pretty good report for Florida.
The decline in Orlando's unemployment rate was due in part to a somewhat strong job market, but a significant portion resulted from seasonal factors and a decline in the labor force participation rate. What really stood out was that over 90% of the job growth in March was due to leisure and hospitality (3200 out of 3500); that sector also accounted for over 60% of employment growth over the last 12 months. The high concentration of job growth in one sector and the fact that leisure/hospitality jobs have lower pay than most other sectors raises questions about the strength of the Orlando economy. So there's a mixed picture for metro Orlando: a sizeable decline in the unemployment rate, but employment growth concentrated in one of the lowest paying sectors. One other item to note is that construction employment declined in March as well as over the last 12 months, which does not seem to fit with the anecdotal evidence of increasing construction activity.
What are the key takeaways? Job growth in Florida is outpacing that of the nation over the last year, though Orlando is coming up short (1.9% growth for Florida, 1.4% for the US, and 1.3% for Orlando). Given cutbacks in government employment, private sector employment growth is stronger (2.4% for Florida, 1.6% for Orlando). Florida's labor market continues to improve, but similar to the nation, a declining participation rate is contributing to the declining unemployment rate. Orlando's job market also is improving, but there are concerns about the quality of jobs as well as growth being concentrated in one sector rather than broad-based gains.
Wednesday, April 17, 2013
Impact of National Debt: Rogoff-Reinhart vs. Herndon-Ash-Pollin
A lot of economic research sits on shelves collecting dust or, more recently, is read online by others doing economic research. In recent days, some research has been reported by various business news services and social media. Ken Rogoff and Carmen Reinhart have received much acclaim in recent years for research about financial crises (for example, see This Time is Different). Before most people could imagine a financial crisis taking place in the United States, they provided research indicating that it was a distinct possibility (click here). A follow up piece of research examined the impact of national debt on economic growth, with one of the main conclusions being that nations with a national debt of more than 90% of GDP tend to grow more slowly ("Growth in the Time of Debt"). Here's a relevant quote from the abstract of the paper:
"Above 90 percent, median growth rates fall by one percent, and average growth falls considerably more."
Rogoff and Reinhart provided their data to other economists who claimed to have found some errors in the data set which have some impact on the conclusions (see Herndon, Hash, and Pollin). Rogoff and Reinhart responded by acknowledging one of the mistakes while defending other parts of their research. The mistake involved a simple excel error that left out certain countries. How does the new research affect the conclusions? As far as I can tell, there is not a significant change in the median growth rate, but the average growth rate for high-debt countries following WW2 goes from -0.1% to 2.2%. The critics point out that this suggests that countries shouldn't worry as much about high debt while Rogoff and Reinhart point out that this still implies slower growth for high-debt countries (3.1-3.2% for those between 30-90% debt levels and 2.2% for those above 90%) and also is now more in line with other research they have published since then covering a longer time period. A reduction in growth of 1% per year adds up over time (think about the US experiencing a weak recovery with an average growth rate of 2% instead of a stronger recovery with growth of 3%). There are a lot of other issues involved, but this is a blog post, not a research paper. Why is it getting so much public attention?
Most of the attention is coming from critics of austerity and those on the left side of political spectrum. They view the updated results as suggesting that countries shouldn't have to worry as much about high national debt. Some also claim that the initial results provided the support for austerity programs being implemented around the world. Are they correct?
First, Rogoff and Reinhart were careful to indicate that they thought they found a correlation, not a causation. In other words, they didn't explicitly state that their results indicated that high debt levels led to slower growth, though that was implied. Critics point out that weakening economic conditions result in higher debt, so it's possible that the weak growth led to high debt rather than the other way around. Rogoff and Reinhart acknowledge this possibility, but point out that they looked at countries with weak growth and high debt for extended periods of time, not simple recessions.
Second, does it make sense for 90% to be a threshold? I don't see any economic reasoning for a threshold number. Some countries can have higher debt loads before suffering consequences while others may face debt crises at lower debt loads (implied by Rogoff and Reinhart as they drew different thresholds for developing economies as opposed to developed economies). Other factors play a role such as the domestic savings rate, monetary policy, perceived credibility of the government's fiscal policy, etc.
Did this research provide the basis for austerity? I think that's a very hard claim to justify. Austerity programs in Europe resulted from various governments being unable to finance their debt. For example, Greece is being forced to implement austerity as a condition of the European bailout. In addition, since investors won't purchase Greek bonds at reasonable interest rates, there's pressure on the government to reduce their need for financing (i.e., austerity). Is this the best approach? That's debatable; but the motivation was not academic research, but real world pressure.
Did political conservatives try to use the research to support their perspective? Of course. That's one of the points of this blog; it's important to separate economics from politics. Too many people with political agendas choose to use research that supports their bias. Similarly, it would be improper for liberals to say there's no need to ever worry about debt loads (I'm not saying that's being said).
Does the national debt matter? The recent experiences in Europe as well as other historical experiences clearly indicate that it does. Nations with high debt loads that have difficulty financing their debt will experience higher interest rates that hurt economic growth, result in higher interest on the debt which crowds out other programs, etc. Policies that seek to reduce the budget deficit in the short run (austerity) hurt economic growth and must be implemented with care. Ideally, governments should put policies in places that avoid debt crises such as running budget surpluses during good economic times so there's more room for budget deficits during bad economic times. As those in Europe can attest, pressure to implement austerity when the economy is weak should be avoided if at all possible.
Did Rogoff and Reinhart deliberately make mistakes? That's hard to believe. They have been serious economists for years and had already received praise for their work on financial crises. In the past, they had been criticized by political conservatives for showing that recoveries from financial crises tend to be slow (and thus President Obama can't be fully blamed for the slow recovery). Now they are being criticized by those on the left for research about problems resulting from high debt levels. They made an embarrassing mistake, but seem to be researching economics without an agenda.
Friday, April 5, 2013
March Employment Report
Yes, this blog is still active. This morning's job report raises quite a few questions about the state of the economy. First the headlines: the unemployment rate dropped to 7.6%, the lowest since December 2008 (good news? not so fast). The economy added 88,000 jobs (95,000 in the private sector); not a good number. However, there were upward revisions to previous months. Let's look at some of the details.
The labor force participation rate fell to 63.3%, the lowest since May 1979. In addition, the employment-population ratio declined to 58.5% (compared to 62.9% before the recession in November 2007, 59.4% at the end of the recession in June 2009, and a post-recession high of 58.7%). The U6 measure of unemployment declined from 14.3% to 13.8%. Why did U6 fall by so much? The number of people working part-time for economic reasons dropped significantly. Also, there was a larger than normal drop off in the number of people not in the labor force who want a job (that number normally drops for seasonal reasons in March, but the decline was much larger than usual). If that trend continues, it would suggest that the decline in the participation rate may be more permanent (i.e., people may not re-enter the labor force when conditions improve).
On to employment: after growing by 268,000 in February, nonfarm payrolls added only 88,000 in March. Which sectors slowed down? After adding 14,600 jobs in February, retail trade lost 24,100 jobs in March, led by declines in clothing stores (down 15,300) and building material stores (down 10,100). Which sectors added jobs? Temp agencies added more than 20,000 workers, food and drinking places added 13,000 (both low-paying sectors). The brightest spot was specialty trade contractors (part of construction), which added over 23,000 jobs. Was the slowdown a direct result of sequestration? Though the federal government shed 14,000 jobs, most of that was due to the trimming of postal workers (down 11,700). Though sequestration is likely to have an impact down the road, it's effects were minimal in March.
What's the initial takeaway? Given the strong February report, one should not read too much in the March report, but it does raise concerns. However, this was not a good report. Both the establishment and household surveys were weak. There's evidence that more people are "permanently" leaving the labor force. Also, though construction is growing, other parts of the economy are sluggish. Sequestration played little, if any, role, but the increase in the payroll tax probably had a more significant impact. I hope to post more thoughts later today after digging into the report a little more.
Afternoon Update: Though seasonal adjustments seemed to have distorted the employment data in recent years, that does not appear to be an issue in this case. For example, using the average seasonal adjustments from before the recession would have resulted in an even a smaller increase in employment in March. Also, several people have noted the Spring slowdowns in the last two years. In 2011, the slowdown began in May (a gain of 115,000 compared to 304,000 in April) with a brief rebound in June before a summer slump. In 2012, the slowdown began in April and lasted through the summer. So this slowdown is earlier than in recent years. Of course, one must be cautious in reading too much in one month's report.
Friday, March 8, 2013
February Employment Report
The headlines from the February Employment Report contained some better than expected news about the job market: the unemployment rate fell to 7.7% (from 7.9%) and the economy added 236,000 jobs (246,000 in the private sector. Let's look at some of the details. The February numbers look quite good, but should be interpreted along with somewhat weaker numbers for January to assess the trend. For example, though the private sector added 246,000 jobs in February, it added 140,000 in January, which averages 193,000 per month so far in 2013. Looking at particular sectors, construction has added 140,000 jobs over the past year, a majority of those in the last 2 months (+73,000 in 2013). To empahsize the significance of the pickup in construction, it added about 8,000 jobs per month, on average, in 2012, but is averaging more than 36,000 per month so far in 2013. Other sectors and industries showing significant gains include retail trade, food accomodations, and health care. One industry that you may not have expected to make a significant contribution, motion picture and sound recording industries, added nearly 21,000 jobs in February.
Why did the unemployment rate fall? A combination of more people employed and fewer people in the labor force. The participation rate declined back to a 30-year low of 63.5% (the last time it was lower was in 1979). Meanwhile, the employment-population ratio remained at 58.6%, unchanged so far in 2013 as well as from February 2012, but up from the post-recession low of 58.2% in November 2010 and still considerably below it's pre-recession high of 62.9% in November 2007.
What are the key takeaways from the report? The job market has gotten off to a pretty good start in 2013, led by the rebound in construction. That said, the employment gains in February were across the board, not concentrated in one sector. Given the weakness in January, the job market is not signaling a robust economy, but an economy that continues to move forward. In the coming months, there will be a battle between the rebounding housing market as seen in rising employment in construction and the fiscal drag due to the increase in the payroll tax and sequestration.
Subscribe to:
Posts (Atom)