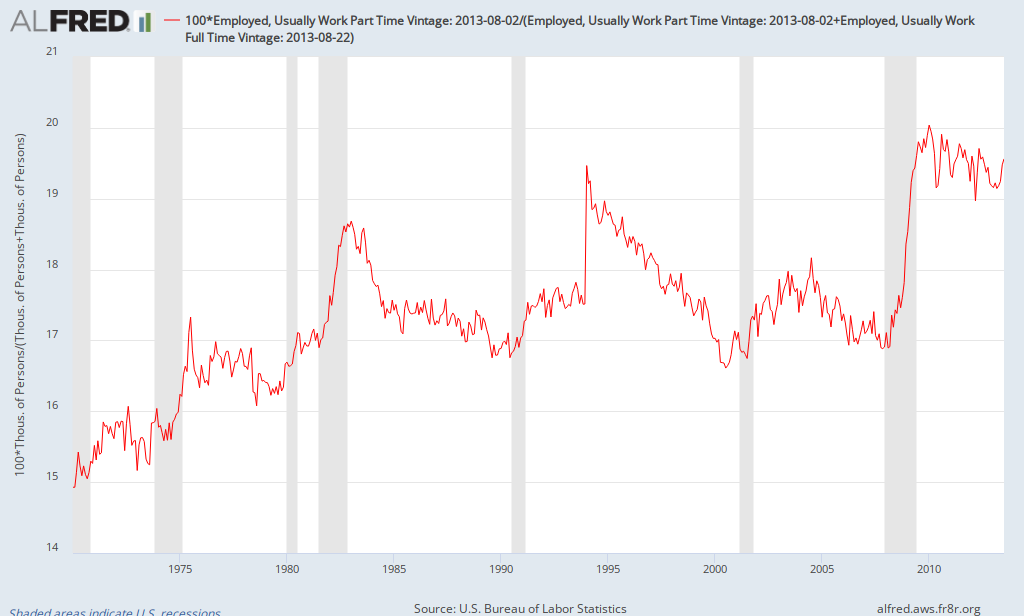
After rising during the 1970s, the percentage of part-time employment tended to be cyclical, rising during recessions and falling during expansions. It was 17% in 1980 and, after nearly three decades of ups and downs, it was 17% at the start of the Great Recession. As during previous recessions, it rose from 2007 to 2009, reaching a high of 20% (the largest increase since records started being kept in 1968). After declining modestly through the end of 2012, it has risen back to 19.6% as of July 2013.
It remains to be seen whether it rises a little more, stabilizes near its current rate, or resumes a slow decline over time. Regardless, it appears that it will take a long time to return to 17% (if ever). Why the increase in the ratio of part-time employment? Regardless which side you take in terms of the relative role of the weak recovery vs. Obamacare, increasing the cost of full-time employment relative to part-time employment can't help but encourage a greater reliance on part-time jobs.