The first estimate of first quarter GDP was released this morning and it showed that economic growth was less than the consensus estimate at 2.5% (consensus was about 3%). The good news was that consumption rose by 3.2%, residential investment rose by 12.6%, and exports rose by 2.9%. Why was the report weaker than expected? Business investment rose by only 2.1% and defense spending declined by 11.5% (on top of a 22% decline in the fourth quarter of 2012). After subtracting from growth at the end of 2012, inventories added about 1% to growth in the first quarter; subtracting inventories from GDP means that final sales rose by 1.5% in the first quarter.
How does this affect the outlook for the rest of the year? The sluggishness in business investment indicates that businesses remain cautious and may indicate sluggishness in hiring as well (similar to the March employment report). Though consumer spending grew at a quicker pace than any time since the end of 2010, it's unlikely to continue at that pace, given the expiration of the payroll tax cut at the beginning of this year (other data suggests that it started to hurt consumer spending late in the first quarter and that weakness will show up in the second quarter numbers). On a more positive note, residential investment remains strong and is likely to continue to be the strongest point of the economy for the rest of 2013. Also, it's unlikely that defense spending will continue to fall as quickly and thus will cease to be a drag on growth.
What's the key takeaways? More of the same, but for different reasons. The economy is likely to continue to grow at a modest pace, close to 2%. Consumer spending will constrained by the reduction in disposable income resulting from the increase in the payroll tax. Business investment, after rebounding strongly in 2010-2011, has grown modestly over the last year and is likely to continue on that path. It looks like 2013 will be another year of slow recovery with modest economic growth.
Friday, April 26, 2013
Thursday, April 25, 2013
Progress in Consumer Deleveraging and Housing: How Far We've Come
During the depths of the financial crisis, a few charts made it clear that consumers needed to deleverage and housing prices had to come down considerably from bubble levels. I thought it would be helpful to see how much progress has been made in recent years to get a better idea as to how much further the economy has to go to correct the excesses of the early- to mid-2000s.
The first chart is the Case-Shiller Home Price index from 1890-2012, which shows a housing price index adjusted for inflation:

After moving between 60 and 140 for a century, the index spiked to 220 in late 2005, clearly indicating the existence of a housing bubble. As of late 2012, the index was down to 134.5 and appeared to be stabilizing (even increasing somewhat). Though this is still a little high by historical standards, it is in line with the performance since WW2.
The second chart is the ratio of consumer debt (credit market debt) to disposable income from the early 1950s to the present:
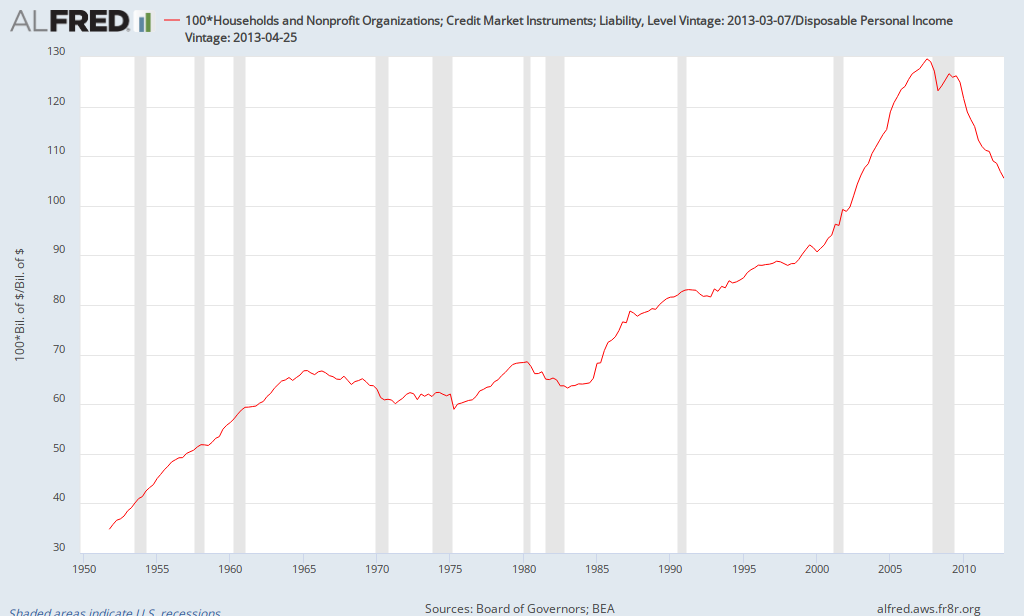
As can be seen, there was an upward trend over time, but the ratio jumped during the 2000s, rising from about 90% at the start of the century to 130% in the summer of 2007. Consumer deleveraging was essential to return to historical trends. As of the end of 2012, it was down to 105%. Though there's not a magic number that indicates deleveraging is complete, much progress has been made and it appears that it is now closer to the upward trend from the late 1980s to 2000. Of course the upward trend from the 1980s and 1990s was probably not sustainable (otherwise the ratio would continue to rise indefinitely). Whether the ratio should be 105% or 100% or..., it appears that most of the deleveraging has already taken place.
Though there are other indicators to consider, it appears that some of the excesses of the bubble era have been corrected, returning closer to historical norms.
The first chart is the Case-Shiller Home Price index from 1890-2012, which shows a housing price index adjusted for inflation:
After moving between 60 and 140 for a century, the index spiked to 220 in late 2005, clearly indicating the existence of a housing bubble. As of late 2012, the index was down to 134.5 and appeared to be stabilizing (even increasing somewhat). Though this is still a little high by historical standards, it is in line with the performance since WW2.
The second chart is the ratio of consumer debt (credit market debt) to disposable income from the early 1950s to the present:
As can be seen, there was an upward trend over time, but the ratio jumped during the 2000s, rising from about 90% at the start of the century to 130% in the summer of 2007. Consumer deleveraging was essential to return to historical trends. As of the end of 2012, it was down to 105%. Though there's not a magic number that indicates deleveraging is complete, much progress has been made and it appears that it is now closer to the upward trend from the late 1980s to 2000. Of course the upward trend from the 1980s and 1990s was probably not sustainable (otherwise the ratio would continue to rise indefinitely). Whether the ratio should be 105% or 100% or..., it appears that most of the deleveraging has already taken place.
Though there are other indicators to consider, it appears that some of the excesses of the bubble era have been corrected, returning closer to historical norms.
Sunday, April 21, 2013
Some Thoughts on the Employment Report for Florida and Metro Orlando
The latest information about the job market in Florida and Orlando was released on Friday. The headline numbers looked good: Florida added nearly 33,000 jobs in March and the unemployment rate fell to 7.5% while the unemployment rate in Orlando declined to 6.6% with employment rising by 3500 (metro data are not seasonally adjusted). Of course it's important to look at the details.
The entire decline in the unemployment rate for Florida was due to a decline in the labor force participation rate, which fell from 60.5% to 60.3%. If the participation had remained constant, the unemployment rate would be 7.8%. In terms of nonfarm payrolls (employment), nearly a third of the jobs were in accommodations and food services. However, a sizeable portion was also in construction, which was the fastest growing sector of the economy. Add it up and it was a pretty good report for Florida.
The decline in Orlando's unemployment rate was due in part to a somewhat strong job market, but a significant portion resulted from seasonal factors and a decline in the labor force participation rate. What really stood out was that over 90% of the job growth in March was due to leisure and hospitality (3200 out of 3500); that sector also accounted for over 60% of employment growth over the last 12 months. The high concentration of job growth in one sector and the fact that leisure/hospitality jobs have lower pay than most other sectors raises questions about the strength of the Orlando economy. So there's a mixed picture for metro Orlando: a sizeable decline in the unemployment rate, but employment growth concentrated in one of the lowest paying sectors. One other item to note is that construction employment declined in March as well as over the last 12 months, which does not seem to fit with the anecdotal evidence of increasing construction activity.
What are the key takeaways? Job growth in Florida is outpacing that of the nation over the last year, though Orlando is coming up short (1.9% growth for Florida, 1.4% for the US, and 1.3% for Orlando). Given cutbacks in government employment, private sector employment growth is stronger (2.4% for Florida, 1.6% for Orlando). Florida's labor market continues to improve, but similar to the nation, a declining participation rate is contributing to the declining unemployment rate. Orlando's job market also is improving, but there are concerns about the quality of jobs as well as growth being concentrated in one sector rather than broad-based gains.
Wednesday, April 17, 2013
Impact of National Debt: Rogoff-Reinhart vs. Herndon-Ash-Pollin
A lot of economic research sits on shelves collecting dust or, more recently, is read online by others doing economic research. In recent days, some research has been reported by various business news services and social media. Ken Rogoff and Carmen Reinhart have received much acclaim in recent years for research about financial crises (for example, see This Time is Different). Before most people could imagine a financial crisis taking place in the United States, they provided research indicating that it was a distinct possibility (click here). A follow up piece of research examined the impact of national debt on economic growth, with one of the main conclusions being that nations with a national debt of more than 90% of GDP tend to grow more slowly ("Growth in the Time of Debt"). Here's a relevant quote from the abstract of the paper:
"Above 90 percent, median growth rates fall by one percent, and average growth falls considerably more."
Rogoff and Reinhart provided their data to other economists who claimed to have found some errors in the data set which have some impact on the conclusions (see Herndon, Hash, and Pollin). Rogoff and Reinhart responded by acknowledging one of the mistakes while defending other parts of their research. The mistake involved a simple excel error that left out certain countries. How does the new research affect the conclusions? As far as I can tell, there is not a significant change in the median growth rate, but the average growth rate for high-debt countries following WW2 goes from -0.1% to 2.2%. The critics point out that this suggests that countries shouldn't worry as much about high debt while Rogoff and Reinhart point out that this still implies slower growth for high-debt countries (3.1-3.2% for those between 30-90% debt levels and 2.2% for those above 90%) and also is now more in line with other research they have published since then covering a longer time period. A reduction in growth of 1% per year adds up over time (think about the US experiencing a weak recovery with an average growth rate of 2% instead of a stronger recovery with growth of 3%). There are a lot of other issues involved, but this is a blog post, not a research paper. Why is it getting so much public attention?
Most of the attention is coming from critics of austerity and those on the left side of political spectrum. They view the updated results as suggesting that countries shouldn't have to worry as much about high national debt. Some also claim that the initial results provided the support for austerity programs being implemented around the world. Are they correct?
First, Rogoff and Reinhart were careful to indicate that they thought they found a correlation, not a causation. In other words, they didn't explicitly state that their results indicated that high debt levels led to slower growth, though that was implied. Critics point out that weakening economic conditions result in higher debt, so it's possible that the weak growth led to high debt rather than the other way around. Rogoff and Reinhart acknowledge this possibility, but point out that they looked at countries with weak growth and high debt for extended periods of time, not simple recessions.
Second, does it make sense for 90% to be a threshold? I don't see any economic reasoning for a threshold number. Some countries can have higher debt loads before suffering consequences while others may face debt crises at lower debt loads (implied by Rogoff and Reinhart as they drew different thresholds for developing economies as opposed to developed economies). Other factors play a role such as the domestic savings rate, monetary policy, perceived credibility of the government's fiscal policy, etc.
Did this research provide the basis for austerity? I think that's a very hard claim to justify. Austerity programs in Europe resulted from various governments being unable to finance their debt. For example, Greece is being forced to implement austerity as a condition of the European bailout. In addition, since investors won't purchase Greek bonds at reasonable interest rates, there's pressure on the government to reduce their need for financing (i.e., austerity). Is this the best approach? That's debatable; but the motivation was not academic research, but real world pressure.
Did political conservatives try to use the research to support their perspective? Of course. That's one of the points of this blog; it's important to separate economics from politics. Too many people with political agendas choose to use research that supports their bias. Similarly, it would be improper for liberals to say there's no need to ever worry about debt loads (I'm not saying that's being said).
Does the national debt matter? The recent experiences in Europe as well as other historical experiences clearly indicate that it does. Nations with high debt loads that have difficulty financing their debt will experience higher interest rates that hurt economic growth, result in higher interest on the debt which crowds out other programs, etc. Policies that seek to reduce the budget deficit in the short run (austerity) hurt economic growth and must be implemented with care. Ideally, governments should put policies in places that avoid debt crises such as running budget surpluses during good economic times so there's more room for budget deficits during bad economic times. As those in Europe can attest, pressure to implement austerity when the economy is weak should be avoided if at all possible.
Did Rogoff and Reinhart deliberately make mistakes? That's hard to believe. They have been serious economists for years and had already received praise for their work on financial crises. In the past, they had been criticized by political conservatives for showing that recoveries from financial crises tend to be slow (and thus President Obama can't be fully blamed for the slow recovery). Now they are being criticized by those on the left for research about problems resulting from high debt levels. They made an embarrassing mistake, but seem to be researching economics without an agenda.
Friday, April 5, 2013
March Employment Report
Yes, this blog is still active. This morning's job report raises quite a few questions about the state of the economy. First the headlines: the unemployment rate dropped to 7.6%, the lowest since December 2008 (good news? not so fast). The economy added 88,000 jobs (95,000 in the private sector); not a good number. However, there were upward revisions to previous months. Let's look at some of the details.
The labor force participation rate fell to 63.3%, the lowest since May 1979. In addition, the employment-population ratio declined to 58.5% (compared to 62.9% before the recession in November 2007, 59.4% at the end of the recession in June 2009, and a post-recession high of 58.7%). The U6 measure of unemployment declined from 14.3% to 13.8%. Why did U6 fall by so much? The number of people working part-time for economic reasons dropped significantly. Also, there was a larger than normal drop off in the number of people not in the labor force who want a job (that number normally drops for seasonal reasons in March, but the decline was much larger than usual). If that trend continues, it would suggest that the decline in the participation rate may be more permanent (i.e., people may not re-enter the labor force when conditions improve).
On to employment: after growing by 268,000 in February, nonfarm payrolls added only 88,000 in March. Which sectors slowed down? After adding 14,600 jobs in February, retail trade lost 24,100 jobs in March, led by declines in clothing stores (down 15,300) and building material stores (down 10,100). Which sectors added jobs? Temp agencies added more than 20,000 workers, food and drinking places added 13,000 (both low-paying sectors). The brightest spot was specialty trade contractors (part of construction), which added over 23,000 jobs. Was the slowdown a direct result of sequestration? Though the federal government shed 14,000 jobs, most of that was due to the trimming of postal workers (down 11,700). Though sequestration is likely to have an impact down the road, it's effects were minimal in March.
What's the initial takeaway? Given the strong February report, one should not read too much in the March report, but it does raise concerns. However, this was not a good report. Both the establishment and household surveys were weak. There's evidence that more people are "permanently" leaving the labor force. Also, though construction is growing, other parts of the economy are sluggish. Sequestration played little, if any, role, but the increase in the payroll tax probably had a more significant impact. I hope to post more thoughts later today after digging into the report a little more.
Afternoon Update: Though seasonal adjustments seemed to have distorted the employment data in recent years, that does not appear to be an issue in this case. For example, using the average seasonal adjustments from before the recession would have resulted in an even a smaller increase in employment in March. Also, several people have noted the Spring slowdowns in the last two years. In 2011, the slowdown began in May (a gain of 115,000 compared to 304,000 in April) with a brief rebound in June before a summer slump. In 2012, the slowdown began in April and lasted through the summer. So this slowdown is earlier than in recent years. Of course, one must be cautious in reading too much in one month's report.
Subscribe to:
Posts (Atom)