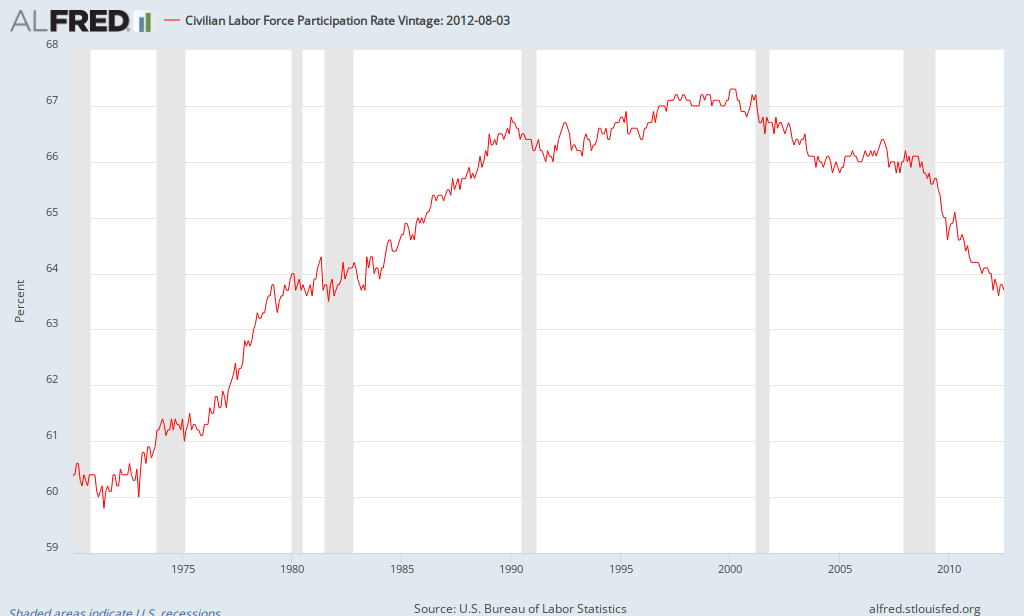
Why did the unemployment rate fall? Many more people dropped out of the labor force (gave up looking for work) and thus are no longer counted as unemployed (387,000 men left the labor force). In fact, the labor force participation rate declined to 63.5%, the lowest since September 1981 (which involved a one-month downward blip); the last time it remained around this rate was 1978. Here's a chart going back to 1970:
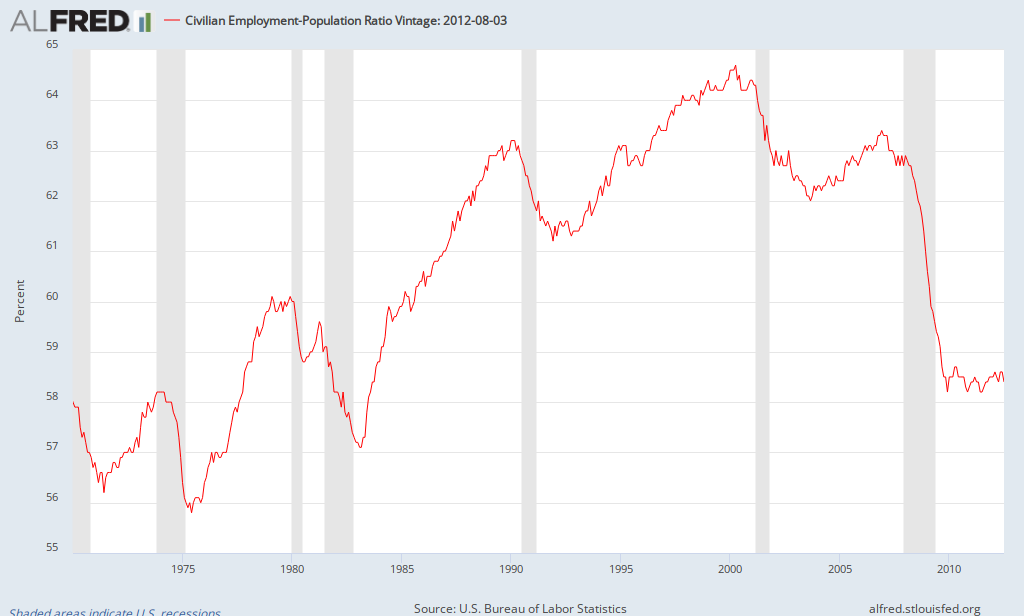
In addition, the employment-population ratio fell to 58.3%, just 0.1% above its recent low (reached a few times in 2009-2011; see chart below):
The type of jobs being created is also meaningful. Nearly 30% of net job creation took place in food and drinking establishments (up 28,000), not exactly the highest paying jobs. Average hourly earnings declined slightly in August while average weekly earnings are up 38 cents in the last year (rose from $655.20 to $655.58).
By now you may be thinking that there has to be some good news in the report. Let's give it a try. Aggregate hours worked increased slightly. Also, computer systems design & related services added over 10,000 jobs (probably good paying jobs).
What's the primary takeaway? You guessed it; the economy is still moving forward, but remains sluggish. Much of the improvement in the unemployment rate comes from fewer people participating in the job market. How much? The unemployment rate peaked at 10% in October 2009 with a labor force participation rate of 65%. If the labor force participation rate had remained the same, the unemployment rate would have risen to 10.2% instead of declining to 8.1%.